
Community Data
Social and Civic Environment
We are currently transitioning our Community Data to an integrated dashboard across the vital conditions through Thriving Together. All data currently published on our website will remain accessible and available to you. The new dashboard will offer an updated approach to how we produce and present community data.
Key Measures
Key Measures help us better understand how our community is changing over time.
If you have questions, please contact info@forsythfutures.org.
Electoral Participation
Civic engagement refers to many aspects of community interactions including volunteerism, participation in social or religious organizations, and voter turnout. One measure of an engaged community is its levels of political or electoral participation, commonly measured through trends in voter turnout. Increased levels of voter turnout can lead to increased levels of community representation among leaders, which can lead to increased levels of social trust and positive health outcomes[1,2].
The electoral participation rate is based on how many citizens over the age of 18 have turned out and participated in the general elections for both Presidential and Non-Presidential Elections.
- Kawachi, I., Kennedy, B. P., & Glass, R. (1999). Social capital and self-rated health: a contextual analysis. American journal of public health, 89(8), 1187-1193.
- Kawachi, I., & Kennedy, B. P. (1997). Socioeconomic determinants of health: Health and social cohesion: why care about income inequality?. Bmj, 314(7086), 1037.
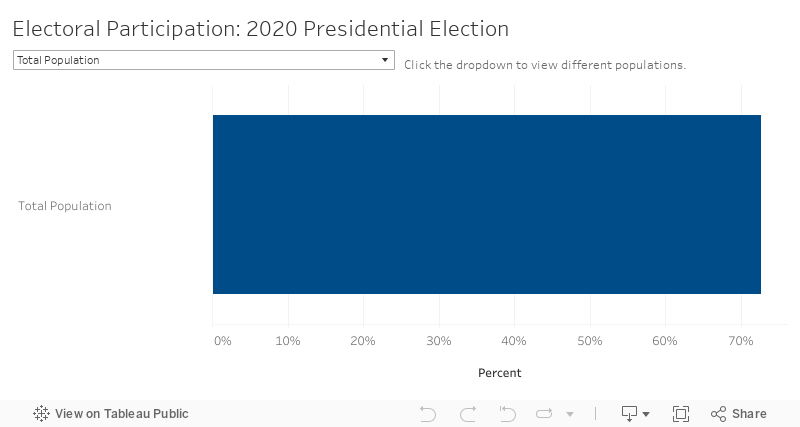
Presidential elections yield higher participation. Presidential elections generally have higher participation rates in Forsyth County than general elections. Electoral participation was higher in the 2018 general election than the 2014 general election. Additionally, 73% of citizens voted in the 2020 presidential election compared to 58% in 2016 and 60% in 2012.
Participation in the 2020 presidential election was highest among older residents. Approximately 92% of residents at least 65 years old participated in the 2020 presidential election. Residents aged 18 to 25 years old had the lowest participation rate among all age groups with about 53% of eligible voters participating in the 2020 election.
There were higher rates of participation among women in the 2020 election cycle.
Disparities are present in participation rates by race/ethnicity. White residents had higher participation rates in the 2020 election cycle than Black or African American residents.
The race/ethnicity disaggregation does not include Hispanic/Latino residents due to incomplete voter registration data.
Data Sources
- U.S. Census Bureau (2020). American Community Survey (ACS), 1-Year Public Use Microdata Sample (PUMS), 2012-2019. Retrieved from Public Use Microdata Sample (PUMS).
- North Carolina State Board of Elections (n.d.). Voter History Data. Retrieved from https://www.ncsbe.gov/results-data/voter-history-data.
Concentrated Poverty
When a large portion of a neighborhood’s residents are experiencing poverty, there can be negative consequences for the entire neighborhood[1,2]. Residents living in areas of concentrated poverty may or may not be in poverty themselves, but are more likely to be in poverty in the future[2,4]. This effect is particularly pronounced for children; one study found that children were 50% more likely to have significantly less income than their parents when growing up in a high-poverty neighborhood[4].
- Kneebone, E., & Holmes, N. (2016). U.S. concentrated poverty in the wake of the great recession. Retrieved from https:/www.brookings.edu/research/u-s-concentrated-poverty-in-the-wake-of-the-great-recession
- Rothwell, J. (2014). The Neighborhood effect: Localities and upward mobility. Retrieved from https:/www.brookings.edu/blog/social-mobility-memos/2014/11/12/the-neighborhood-effect-localities-and-upward-mobility
- Kneebone, E., Nadeau, C., & Berube, A. (2011). The re-emergence of concentrated poverty. Retrieved from https://www.brookings.edu/research/the-re-emergence-of-concentrated-poverty-metropolitan-trends-in-the-2000s
- Sharkey, P. (2009). Neighborhoods and the black-white mobility gap. Retrieved from http:/www.pewtrusts.org/~/media/legacy/uploadedfiles/wwwpewtrustsorg/reports/economic_mobility/pewsharkeyv12pdf.pdf
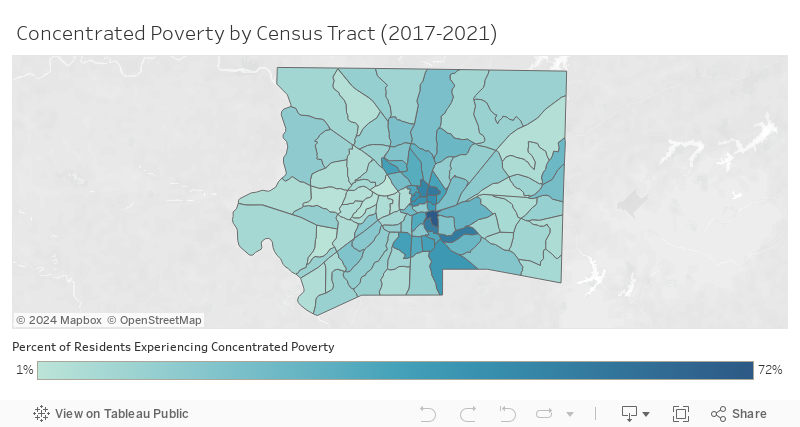
From 2017-2021, the concentrated poverty rate was 7% in Forsyth County which was a decrease from 2012-2016 when the rate was 9%.
Among all comparison communities, concentrated poverty was highest in Forsyth County.
Disparities were present in concentrated poverty rates by race/ethnicity. From 2017-2021, Black or African American and Hispanic/Latino residents had higher concentrated poverty rates than White, non-Hispanic residents.
Among all age groups, younger residents (under 18 years) had the highest rate of concentrated poverty from 2017-2021.
Due to pandemic disruptions, 2020 data is not comparable to previous years. To learn more about these disruptions click here.
Data Sources
- U.S. Census Bureau (2022). Poverty Status in the Past 12 Months: Table S1701, 2012-2016 and 2017-2021 American Community Survey 5-Year Estimates. Retrieved from data.census.gov.
Key Measures
Key Measures help us better understand how our community is changing over time.
If you have questions, please contact info@forsythfutures.org.
Electoral Participation
About
Civic engagement refers to many aspects of community interactions including volunteerism, participation in social or religious organizations, and voter turnout. One measure of an engaged community is its levels of political or electoral participation, commonly measured through trends in voter turnout. Increased levels of voter turnout can lead to increased levels of community representation among leaders, which can lead to increased levels of social trust and positive health outcomes[1,2].
The electoral participation rate is based on how many citizens over the age of 18 have turned out and participated in the general elections for both Presidential and Non-Presidential Elections.
- Kawachi, I., Kennedy, B. P., & Glass, R. (1999). Social capital and self-rated health: a contextual analysis. American journal of public health, 89(8), 1187-1193.
- Kawachi, I., & Kennedy, B. P. (1997). Socioeconomic determinants of health: Health and social cohesion: why care about income inequality?. Bmj, 314(7086), 1037.
Data
Key Points
Presidential elections yield higher participation. Presidential elections generally have higher participation rates in Forsyth County than general elections. Electoral participation was higher in the 2018 general election than the 2014 general election. Additionally, 73% of citizens voted in the 2020 presidential election compared to 58% in 2016 and 60% in 2012.
Participation in the 2020 presidential election was highest among older residents. Approximately 92% of residents at least 65 years old participated in the 2020 presidential election. Residents aged 18 to 25 years old had the lowest participation rate among all age groups with about 53% of eligible voters participating in the 2020 election.
There were higher rates of participation among women in the 2020 election cycle.
Disparities are present in participation rates by race/ethnicity. White residents had higher participation rates in the 2020 election cycle than Black or African American residents.
Data Notes
The race/ethnicity disaggregation does not include Hispanic/Latino residents due to incomplete voter registration data.
Data Sources
- U.S. Census Bureau (2020). American Community Survey (ACS), 1-Year Public Use Microdata Sample (PUMS), 2012-2019. Retrieved from Public Use Microdata Sample (PUMS).
North Carolina State Board of Elections (n.d.). Voter History Data. Retrieved from https://www.ncsbe.gov/results-data/voter-history-data
Concentrated Poverty
About
When a large portion of a neighborhood’s residents are experiencing poverty, there can be negative consequences for the entire neighborhood[1,2]. Residents living in areas of concentrated poverty may or may not be in poverty themselves, but are more likely to be in poverty in the future[2,4]. This effect is particularly pronounced for children; one study found that children were 50% more likely to have significantly less income than their parents when growing up in a high-poverty neighborhood[4].
- Kneebone, E., & Holmes, N. (2016). U.S. concentrated poverty in the wake of the great recession. Retrieved from https:/www.brookings.edu/research/u-s-concentrated-poverty-in-the-wake-of-the-great-recession
- Rothwell, J. (2014). The Neighborhood effect: Localities and upward mobility. Retrieved from https:/www.brookings.edu/blog/social-mobility-memos/2014/11/12/the-neighborhood-effect-localities-and-upward-mobility
- Kneebone, E., Nadeau, C., & Berube, A. (2011). The re-emergence of concentrated poverty. Retrieved from https://www.brookings.edu/research/the-re-emergence-of-concentrated-poverty-metropolitan-trends-in-the-2000s
- Sharkey, P. (2009). Neighborhoods and the black-white mobility gap. Retrieved from http:/www.pewtrusts.org/~/media/legacy/uploadedfiles/wwwpewtrustsorg/reports/economic_mobility/pewsharkeyv12pdf.pdf
Data
Map
Key Points
From 2017-2021, the concentrated poverty rate was 7% in Forsyth County which was a decrease from 2012-2016 when the rate was 9%.
Among all comparison communities, concentrated poverty was highest in Forsyth County.
Disparities were present in concentrated poverty rates by race/ethnicity. From 2017-2021, Black or African American and Hispanic/Latino residents had higher concentrated poverty rates than White, non-Hispanic residents.
Among all age groups, younger residents (under 18 years) had the highest rate of concentrated poverty from 2017-2021.
Data Notes
Due to pandemic disruptions, 2020 data is not comparable to previous years. To learn more about these disruptions click here.
Data Sources
- U.S. Census Bureau (2022). Poverty Status in the Past 12 Months: Table S1701, 2012-2016 and 2017-2021 American Community Survey 5-Year Estimates. Retrieved from data.census.gov.
Reports and Briefings
This section contains various reports that are relevant to the safety of our community. Listed reports may have been produced by Forsyth Futures or others in the community.
If you have questions, please contact info@forsythfutures.org.
2020 Census Community Briefing Microsite, 2020
Produced by the Forsyth County Complete Count Committee, in partnership with Forsyth Futures.
The Forsyth County Complete Count Committee, in partnership with Forsyth Futures, launched the Census 2020 Community Briefing Microsite as an information hub for community stakeholders to better understand why the 2020 Census matters and how we can work together for a complete and accurate count of our community.
Electoral Participation Making Progress Report, 2013
Produced by Forsyth Futures, 2013.
Forsyth Futures’ Making Progress Reports (MPR) serve as a tool to inform Forsyth County, N.C., residents about current issues, conditions, and trends in six areas: Economic Self-Sufficiency, Educational Success, Engaged Community, Physical and Mental Health, Safety, and Sustainable Environment. The Making Progress Report: Electoral Participation is part of the Engaged Community sector. In engaged communities, residents have a sense of ownership and pride in where they live. Measurements of engaged communities include voting rates, participation in community events, support and enjoyment of cultural opportunities, and levels of volunteering.
Community Research Framework
Individual Forsyth Futures reports are generally written to provide focused information on specific issues to inform community action. While these topics are generally measured in separate reports for clarity, it is important to acknowledge that all of the local issues we study are interconnected. For example, food insecurity is generally measured separately from reading proficiency scores, but in reality being a part of a family experiencing food insecurity can have a significant impact on children’s ability to learn and be successful in school.
Two Complementary Frameworks
To guide our reporting as we navigate this complexity, Forsyth Futures uses two frameworks which consider interconnected topical dimensions and dimensions of context and scale, respectively. Taken together, these two frameworks provide an opportunity for community stakeholders to consider how issues that appear separate in their reporting may be interconnected.

Interconnected Topical Dimensions
This framework model shows that despite how topics are separated to make information easier to access and communicate, many of the sectors that we study are interconnected, like a student’s economic stability and their ability to be successful in school.
Built and Physical Environment
Economy and Financial Stability
Education
Health and Wellness
Safety
Social and Civic Environment

Dimensions of Context and Scale
This framework model is based on a commonly-used social determinants of health model called the Social-Ecological model. This model illustrates how individuals and families are impacted by the broader contexts in which they exist. For example, an individual child’s test score measures their reading proficiency at the individual level, but it is important to acknowledge the impact that a child’s family, neighborhood, and school have on the child’s success.