
Community Data
Education
We are currently transitioning our Community Data to an integrated dashboard across the vital conditions through Thriving Together. All data currently published on our website will remain accessible and available to you. The new dashboard will offer an updated approach to how we produce and present community data.
Key Measures
Key Measures help us better understand how our community is changing over time.
If you have questions, please contact info@forsythfutures.org.
Third Grade Reading
During the elementary and middle school years, students learn basic reading and math skills. These skills provide the basis for children and young adults to acquire, process, and interpret information about the world. If students do not develop this foundation of basic skills, it can impact their academic success at all future levels of education[1] (e.g. high school graduation, post-secondary completion, job placement, etc.).
From birth to about age eight, around third grade, children learn to read. After third grade, reading increasingly becomes a key part of instruction and how children learn. Children who are unequipped with basic reading skills at the end of third grade are at much greater risk of falling behind in school[1].
The measure used for Reading Proficiency is the reading test taken at the end of third grade. Proficiency on this test is defined as possessing the skills required to read at a third grade level.
- Annie E. Casey Foundation. (2010). EARLY WARNING! Why Reading by the End of Third Grade Matters.
The rate of students meeting third grade reading proficiency standards has decreased over time. In the 2021-2022 school year, 40% met third grade reading proficiency standards compared to 58% of students in the 2013-2014 school year.
There were disparities in third grade reading proficiency by race/ethnicity. About a quarter (26%) of Hispanic/Latino and Black students met third grade reading proficiency standards in 2021-2022 compared to approximately 63% of White students.
There were disparities by sex with about 42% of females meeting third grade proficiency standards during the 2021-2022 school year compared to 39% of males.
There were disparities in third grade reading proficiency by economic status. In the 2021-2022 school year, about a quarter (26%) of economically disadvantaged students met proficiency standards compared to 55% of students who were not economically disadvantaged.
Data Sources
- North Carolina Department of Public Instruction. (n.d.). 2021-22 School Assessment and Other Indicator Data. Retrieved from https://www.dpi.nc.gov.
If you are interested in using data from this report for rigorous purposes (such as program planning), please contact info@forsythfutures.org for a consultation on how best to proceed.
ACT Proficiency
Colleges and universities expect students to have the skills and knowledge to tackle college-level coursework. Students who are not proficient on the ACT are less likely to be prepared for college, more likely to frequently spend time and money taking remedial courses, and are less likely to be successful in completing their degree[1].
The American College Testing (ACT) assessment, which is taken by all 11th grade students in North Carolina, measures college readiness in reading, math, science, and English. In North Carolina, proficiency on the ACT is considered to be a composite score of 17 or above – the minimum score required for admission into the University of North Carolina system.
- Alliance for Excellent Education. (2011, May). Saving Now and Saving Later: How High School Reform Can Reduce the Nation’s Wasted Remediation Dollars. Retrieved from http://all4ed.org/wp-content/uploads/2013/06/SavingNowSavingLaterRemediation.pdf
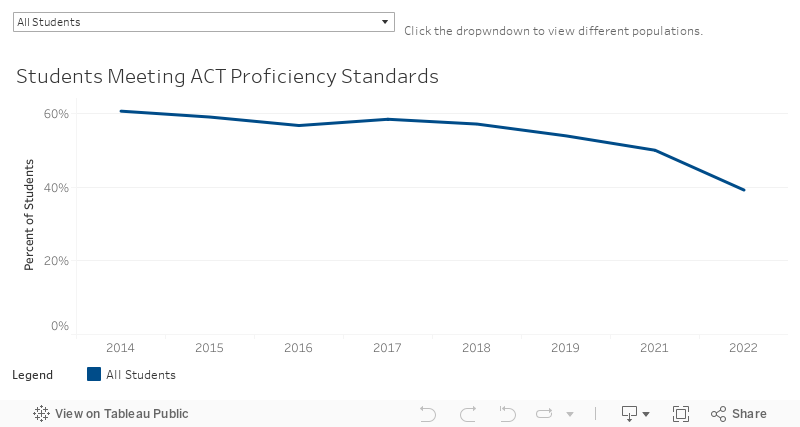
The rate of students meeting ACT proficiency standards has decreased over time. In the 2021-2022 school year, 39% met ACT proficiency standards compared to 61% of students in the 2013-2014 school year.
Disparities were present in ACT proficiency among students by economic status. About 17% of economically disadvantaged students met ACT proficiency standards compared to 51% of economically advantaged students.
Disparities were present in ACT proficiency among students by race/ethnicity. In 2021-2022, 18% of Black students and 20% of Hispanic/Latino students met ACT proficiency standards compared to about 64% of White students.
Disparities were present in ACT proficiency by sex. Female students had higher proficiency rates than males in the 2021-2022 school year.
Data Notes
Forsyth County schools had no ACT testing in the 2020-2021 school year due to the COVID-19 pandemic.
Data Sources
- North Carolina Department of Public Instruction. (n.d.). 2021-22 School Assessment and Other Indicator Data. Retrieved from https://www.dpi.nc.gov.
If you are interested in using data from this report for rigorous purposes (such as program planning), please contact info@forsythfutures.org for a consultation on how best to proceed.
Post-Secondary Completion
Education plays a significant role in social mobility, the prevention of poverty, the ability for people to avoid the conditions of poverty, and the reduction of crime rates[1-4]. Graduating from college or community college significantly increases the likelihood of an individual’s economic success[3-6].
Post-secondary education — education attained after high school — plays an important role in upward mobility[3]. This includes but is not limited to: college, community college, and university. This measure describes the percentage of the population, 25-years-old and older, with at least an associate’s degree.
While it is recognized that certificate programs are also important to a community, the data for such information is not currently available for analysis.
- Haskins, R. (2011). Fighting poverty the American way. Anti-Poverty Programs in a Global Perspective: Lessons from Rich and Poor Countries, Social Science Research Center, Berlin, [Record of a Symposium]. June 20-21, 2011. Berlin, Germany. Retrieved from https://www.brookings.edu/wp-content/uploads/2016/06/0620_fighting_poverty_haskins.pdf
- Acs, G. (2011). Downward mobility from the middle class: Waking up from the American dream. Retrieved from http://www.pewtrusts.org/~/media/legacy/uploadedfiles/pcs_assets/2011/middleclassreportpdf.pdf?la=en
- Furchtgott-Roth, D., Jacobson, L., & Mokher, C. (2009). Strengthening community colleges’ influence on economic mobility. Retrieved from http://www.frbsf.org/economic-research/files/Jacobson.pdf
- Sharkey, P., Bryan, G. (2013). Mobility and the metropolis: How communities factor into economic mobility. Retrieved from http://www.pewtrusts.org/~/media/legacy/uploadedfiles/pcs_assets/2013/mobilityandthemetropolispdf.pdf
- Ross, C., & Wu, C. (1995). The links between education and health. American Sociological Review, 60(5), 719-745. Retrieved from http://www.jstor.org/stable/2096319
- Lochner, L. (2007). Education and crime. Retrieved from http://economics.uwo.ca/people/lochner_docs/educationpolicycrime_nov12.pdf
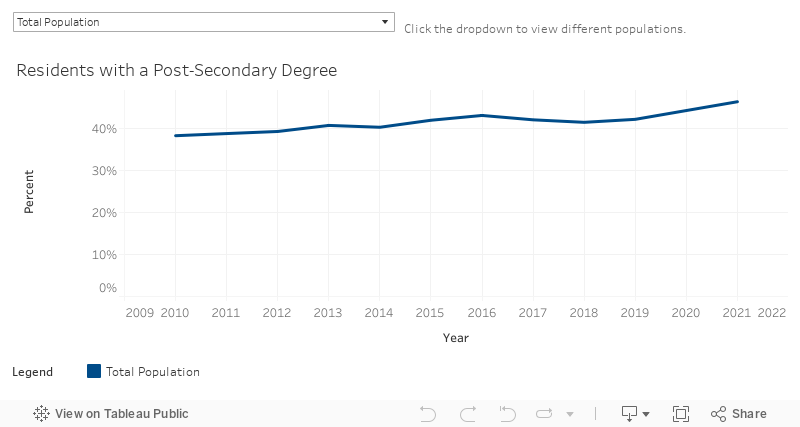
The percentage of the population with a post-secondary degree has increased since 2010. In Forsyth County, approximately 38% of residents had a post-secondary degree in 2010 compared to 46% in 2021. Additionally, the percentage of the population with a post-secondary degree from 2010 to 2021 increased for all comparison communities.
Educational attainment is significantly higher in Durham County. In 2021, 61% of Durham County residents had a post-secondary degree compared to the 44%-46% of residents in the other comparison communities.
There were significantly more female than male residents with a post-secondary degree in 2021. Further, there was an increase in females with a post-secondary degree from 38% in 2010 to 49% in 2021.
Disparities were present in residents with post-secondary degrees by age. Among all age groups, adults 65 years old and older have the lowest percentage of post-secondary degrees.
Disparities were present in residents with post-secondary degrees by race/ethnicity. In 2021, a higher proportion of White residents had a post-secondary degree than Hispanic/Latino residents or Black or African American residents. Additionally, the percentage of Hispanic/Latino residents with a post-secondary nearly tripled from 8% in 2010 to 23% in 2021.
Due to pandemic disruptions, 2020 data is not comparable to previous years.
Data Sources
- U.S. Census Bureau (2022). Sex by Age by Educational Attainment for the Population 18 Years and Over: Table B15001, 2006-2019 and 2021 American Community Survey 1-Year Estimates. Retrieved from data.census.gov.
- U.S. Census Bureau (2022). Sex by Age by Educational Attainment for the Population 25 Years and Over: Table B15002, 2006-2019 and 2021 American Community Survey 1-Year Estimates. Retrieved from data.census.gov.
- U.S. Census Bureau (2022). Sex by Age by Educational Attainment for the Population 25 Years and Over (Hispanic or Latino): Table B15002I, 2006-2019 and 2021 American Community Survey 1-Year Estimates. Retrieved from data.census.gov.
- U.S. Census Bureau (2022). Sex by Age by Educational Attainment for the Population 25 Years and Over (Black or African American Alone): Table B15002B, 2006-2019 and 2021 American Community Survey 1-Year Estimates. Retrieved from data.census.gov.
- U.S. Census Bureau (2022). Sex by Age by Educational Attainment for the Population 18 Years and Over: Table B15002, 2017-2021 American Community Survey 5-Year Estimates. Retrieved from data.census.gov.
If you are interested in using data from this report for rigorous purposes (such as program planning), please contact info@forsythfutures.org for a consultation on how best to proceed.
Key Measures
Key Measures help us better understand how our community is changing over time.
If you have questions, please contact info@forsythfutures.org.
Third Grade Reading
About
During the elementary and middle school years, students learn basic reading and math skills. These skills provide the basis for children and young adults to acquire, process, and interpret information about the world. If students do not develop this foundation of basic skills, it can impact their academic success at all future levels of education[1] (e.g. high school graduation, post-secondary completion, job placement, etc.).
From birth to about age eight, around third grade, children learn to read. After third grade, reading increasingly becomes a key part of instruction and how children learn. Children who are unequipped with basic reading skills at the end of third grade are at much greater risk of falling behind in school[1].
The measure used for Reading Proficiency is the reading test taken at the end of third grade. Proficiency on this test is defined as possessing the skills required to read at a third grade level.
- Annie E. Casey Foundation. (2010). EARLY WARNING! Why Reading by the End of Third Grade Matters.
Data
Key Points
The rate of students meeting third grade reading proficiency standards has decreased over time. In the 2021-2022 school year, 40% met third grade reading proficiency standards compared to 58% of students in the 2013-2014 school year.
There were disparities in third grade reading proficiency by race/ethnicity. About a quarter (26%) of Hispanic/Latino and Black students met third grade reading proficiency standards in 2021-2022 compared to approximately 63% of White students.
There were disparities by sex with about 42% of females meeting third grade proficiency standards during the 2021-2022 school year compared to 39% of males.
There were disparities in third grade reading proficiency by economic status. In the 2021-2022 school year, about a quarter (26%) of economically disadvantaged students met proficiency standards compared to 55% of students who were not economically disadvantaged.
Data Notes
Data Sources
- North Carolina Department of Public Instruction. (n.d.,). 2021-22 School Assessment and Other Indicator Data. Retrieved from https://www.dpi.nc.gov.
If you are interested in using data from this report for rigorous purposes (such as program planning), please contact info@forsythfutures.org for a consultation on how best to proceed.
ACT Proficiency
About
Colleges and universities expect students to have the skills and knowledge to tackle college-level coursework. Students who are not proficient on the ACT are less likely to be prepared for college, more likely to frequently spend time and money taking remedial courses, and are less likely to be successful in completing their degree[1].
The American College Testing (ACT) assessment, which is taken by all 11th grade students in North Carolina, measures college readiness in reading, math, science, and English. In North Carolina, proficiency on the ACT is considered to be a composite score of 17 or above – the minimum score required for admission into the University of North Carolina system.
- Alliance for Excellent Education. (2011, May). Saving Now and Saving Later: How High School Reform Can Reduce the Nation’s Wasted Remediation Dollars. Retrieved from http://all4ed.org/wp-content/uploads/2013/06/SavingNowSavingLaterRemediation.pdf
Data
Key Points
The rate of students meeting ACT proficiency standards has decreased over time. In the 2021-2022 school year, 39% met ACT proficiency standards compared to 61% of students in the 2013-2014 school year.
Disparities were present in ACT proficiency among students by economic status. About 17% of economically disadvantaged students met ACT proficiency standards compared to 51% of economically advantaged students.
Disparities were present in ACT proficiency among students by race/ethnicity. In 2021-2022, 18% of Black and 20% of Hispanic/Latino students met ACT proficiency standards compared to 64% of White students.
Disparities were present in ACT proficiency by sex. Female students had higher proficiency rates than males in the 2021-2022 school year.
Data Notes
Data Notes
Forsyth County schools had no ACT testing in the 2020-2021 school year due to the COVID-19 pandemic.
Data Sources
- North Carolina Department of Public Instruction. (n.d.). 2021-22 School Assessment and Other Indicator Data. Retrieved from https://www.dpi.nc.gov.
If you are interested in using data from this report for rigorous purposes (such as program planning), please contact info@forsythfutures.org for a consultation on how best to proceed.
Post-Secondary Completion
About
Education plays a significant role in social mobility, the prevention of poverty, the ability for people to avoid the conditions of poverty, and the reduction of crime rates[1-4]. Graduating from college or community college significantly increases the likelihood of an individual’s economic success[3-6].
Post-secondary education — education attained after high school — plays an important role in upward mobility[3]. This includes but is not limited to: college, community college, and university. This measure describes the percentage of the population, 25-years-old and older, with at least an associate’s degree.
While it is recognized that certificate programs are also important to a community, the data for such information is not currently available for analysis.
- Haskins, R. (2011). Fighting poverty the American way. Anti-Poverty Programs in a Global Perspective: Lessons from Rich and Poor Countries, Social Science Research Center, Berlin, [Record of a Symposium]. June 20-21, 2011. Berlin, Germany. Retrieved from https://www.brookings.edu/wp-content/uploads/2016/06/0620_fighting_poverty_haskins.pdf
- Acs, G. (2011). Downward mobility from the middle class: Waking up from the American dream. Retrieved from http://www.pewtrusts.org/~/media/legacy/uploadedfiles/pcs_assets/2011/middleclassreportpdf.pdf?la=en
- Furchtgott-Roth, D., Jacobson, L., & Mokher, C. (2009). Strengthening community colleges’ influence on economic mobility. Retrieved from http://www.frbsf.org/economic-research/files/Jacobson.pdf
- Sharkey, P., Bryan, G. (2013). Mobility and the metropolis: How communities factor into economic mobility. Retrieved from http://www.pewtrusts.org/~/media/legacy/uploadedfiles/pcs_assets/2013/mobilityandthemetropolispdf.pdf
- Ross, C., & Wu, C. (1995). The links between education and health. American Sociological Review, 60(5), 719-745. Retrieved from http://www.jstor.org/stable/2096319
- Lochner, L. (2007). Education and crime. Retrieved from http://economics.uwo.ca/people/lochner_docs/educationpolicycrime_nov12.pdf
Data
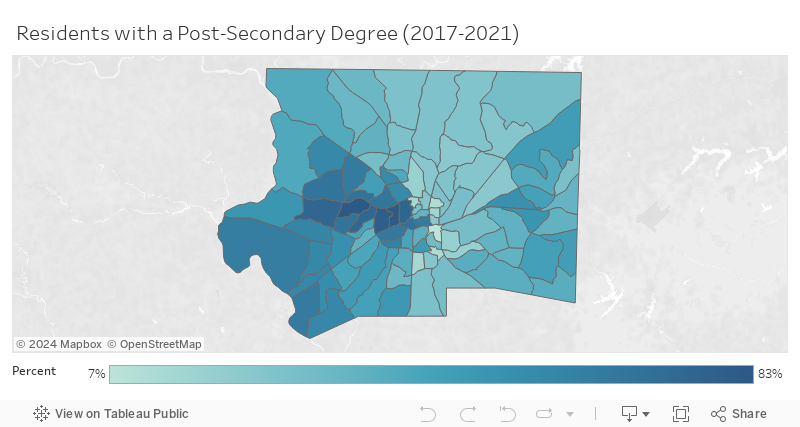
Map
Key Points
The percentage of the population with a post-secondary degree has increased since 2010. In Forsyth County, approximately 38% of residents had a post-secondary degree in 2010 compared to 46% in 2021. Additionally, the percentage of the population with a post-secondary degree from 2010 to 2021 increased for all comparison communities.
Educational attainment is significantly higher in Durham County. In 2021, 61% of Durham County residents had a post-secondary degree compared to the 44%-46% of residents in the other comparison communities.
There were significantly more female than male residents with a post-secondary degree in 2021. Further, there was an increase in females with a post-secondary degree from 38% in 2010 to 49% in 2021.
Disparities were present in residents with post-secondary degrees by age. Among all age groups, adults 65 years old and older have the lowest percentage of post-secondary degrees.
Disparities were present in residents with post-secondary degrees by race/ethnicity. In 2021, a higher proportion of White residents had a post-secondary degree than Hispanic/Latino residents or Black or African American residents. Additionally, the percentage of Hispanic/Latino residents with a post-secondary nearly tripled from 8% in 2010 to 23% in 2021.
Data Notes
Due to pandemic disruptions, 2020 data is not comparable to previous years.
Data Sources
- U.S. Census Bureau (2022). Sex by Age by Educational Attainment for the Population 18 Years and Over: Table B15001, 2006-2019 and 2021 American Community Survey 1-Year Estimates. Retrieved from data.census.gov.
- U.S. Census Bureau (2022). Sex by Age by Educational Attainment for the Population 25 Years and Over: Table B15002, 2006-2019 and 2021 American Community Survey 1-Year Estimates. Retrieved from data.census.gov.
- U.S. Census Bureau (2022). Sex by Age by Educational Attainment for the Population 25 Years and Over (Hispanic or Latino): Table B15002I, 2006-2019 and 2021 American Community Survey 1-Year Estimates. Retrieved from data.census.gov.
- U.S. Census Bureau (2022). Sex by Age by Educational Attainment for the Population 25 Years and Over (Black or African American Alone): Table B15002B, 2006-2019 and 2021 American Community Survey 1-Year Estimates. Retrieved from data.census.gov.
- U.S. Census Bureau (2022). Sex by Age by Educational Attainment for the Population 25 Years and Over (White Alone, not Hispanic or Latino): Table B15002H, 2006-2019 and 2021 American Community Survey 1-Year Estimates. Retrieved from data.census.gov.
- U.S. Census Bureau (2022). Sex by Age by Educational Attainment for the Population 18 Years and Over: Table B15002, 2017-2021 American Community Survey 5-Year Estimates. Retrieved from data.census.gov.
If you are interested in using data from this report for rigorous purposes (such as program planning), please contact info@forsythfutures.org for a consultation on how best to proceed.
Additional Measures
Additional Measures are less detailed than key measures and are intended to provide additional context for community uses such as grant writing and program planning.
If you have questions, please contact info@forsythfutures.org.
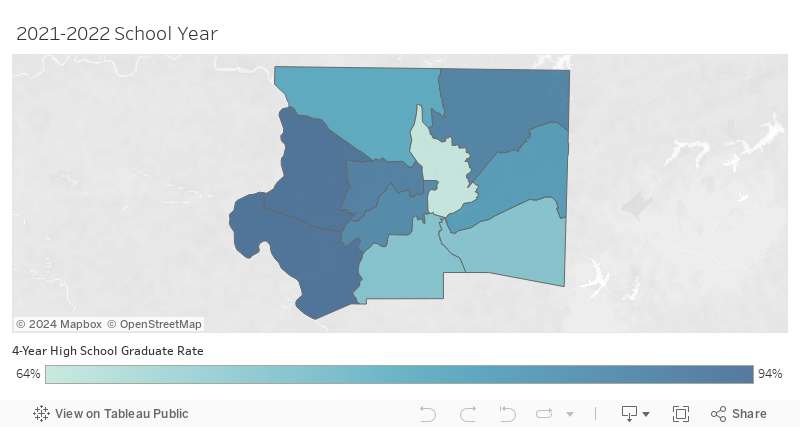
High School Graduation Rate
Data Sources
- North Carolina Department of Public Instruction. (n.d.). Longitudinal Four-year and Five-year Cohort Graduation Rates through 2022 from https://www.dpi.nc.gov.
High School Diploma or Higher
In 2021, 90% of Forsyth County residents 25 years old and older had a high school diploma or higher.
Data Sources
- U.S. Census Bureau (2022). Educational Attainment: Table S1501, 2021 American Community Survey 1-Year Estimates. Retrieved from data.census.gov.
Associate's Degree or Higher
In 2021, 46% of Forsyth County residents, ages 25 and higher, had an Associate’s Degree or higher
Data Sources
- U.S. Census Bureau (2022). Educational Attainment: Table S1501, 2021 American Community Survey 1-Year Estimates. Retrieved from data.census.gov.
Title I Public Schools
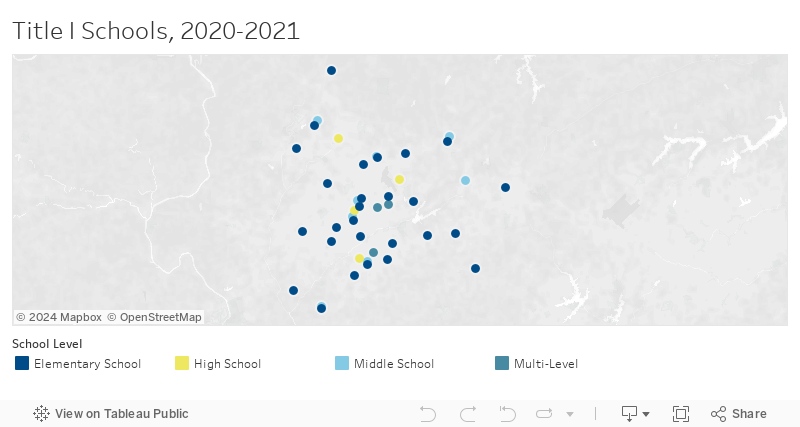
Title I, Part A, of the Elementary and Secondary Education Act (ESEA), is a federally funded program that provides financial assistance to local education agencies (LEAs) and schools. The purpose of the Title I program is to help at-risk students meet the state’s challenging academic content and performance standards. Schools qualify for Title I funds based on economic need. The Title I program offers a variety of services for participating schools, which may include: additional teachers and support staff, extra time for instruction, a variety of teaching methods and materials, smaller classes, and additional training for staff[1].
Reports and Briefings
This section contains various reports that are relevant to education in our community. Listed reports may have been produced by Forsyth Futures or others in the community.
If you have questions, please contact info@forsythfutures.org.
The Forsyth Promise 2020 Community Education Report

Produced by Forsyth Futures in partnership with The Forsyth Promise. Published 2021.
The purpose of The Forsyth Promise 2020 Community Education Report is to share community information so that everyone can better understand our educational systems. This interactive report microsite includes information on core education measures, equity measures, community context, the impact of COVID-19, stories from those with lived experience of our educational systems, and pathways to action. This report is produced annually by The Forsyth Promise.
Through a Gender Lens: The Economic Security of Women and Girls in Forsyth County, 2020

Produced by The Women’s Fund of the Winston-Salem Foundation in partnership with Forsyth Futures.
After seeing the importance of highlighting data that focused on the economic security of women and girls in Forsyth County, The Women’s Fund committed to producing a report of its nature every five years. While we chose a print format for our two previous reports, we decided to take a different approach with our third Through a Gender Lens report by presenting it as an interactive microsite with the goal to make the information more accessible and engaging.
Key Measures Report, 2020
Produced by Forsyth Futures.
Forsyth Futures’ Key Measures Report serves as a compilation of recent, commonly-requested, community-specific, reference information to aid informed public consideration and grant-writing activities in Forsyth County. The contents of this report address demographics and various topics related to the economy, health and wellness, education, and safety in Forsyth County.
The Forsyth Promise Education Report for Forsyth County, 2019

Produced by The Forsyth Promise in partnership with Forsyth Futures.
Striving toward systems change: the data and information contained in the 2019 Education Report for Forsyth County convey how our community is doing in regard to our most critical education measures. The Forsyth Promise’s goal is to support improvement of community-wide education measures for all students and support the reduction (and ultimate elimination) of disparity gaps by race/ethnicity and socioeconomic status
The Forsyth Promise Education Report for Forsyth County, 2018

Produced by The Forsyth Promise in partnership with Forsyth Futures.
The Forsyth Promise’s cradle-to-career civic infrastructure is designed to impact local systems and improve all students’ educational success. Significant change is defined as a change of at least two percentage points over three years. The following data convey how Forsyth County is doing in regard to our core education measures. The Promise’s immediate goal is to achieve two proof points for systems change: 1. at least four of seven core measures are stable or improving year over year for aggregate students and 2. at least two of five disparity gaps are reduced or eliminated.
Forsyth Family Voices, 2018
Produced by Forsyth Futures in partnership with MDC.
Forsyth Family Voices (FFV) is a powerful way to engage the voices of parents and families of young children in the programs that serve them—and in the community’s early childhood system. The FFV approach, using shared survey and focus group tools to listen to and learn from families, was developed collaboratively with a diverse, cross-sector group of agencies representing different fields within the early childhood system. Through FFV, agencies in the Forsyth County early childhood system are collectively building a deeper understanding of the needs, strengths, and ideas of the families they serve.
The Forsyth Promise Education Report for Forsyth County, 2016
Produced by The Forsyth Promise.
The Forsyth Promise is focused on supporting the development of the whole child and is built around improving six primary outcomes that are academic and social-emotional in nature. These outcomes span from birth to young adulthood (see the chart on the next page). For each outcome, at least one indicator, or a measure of success, was selected to track our community’s progress toward the vision of The Forsyth Promise.
Early Care Service System Analysis, 2016
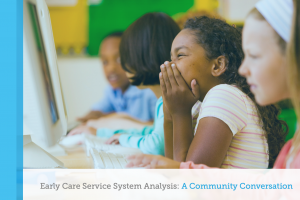
Produced by Forsyth Futures, 2016.
Goals for the Early Care Service System Analysis (ECSSA): Build a common reference point for community services, identify gaps in services, identify opportunities for better coordination, create a framework for developing common community outcomes
A Second Look Through a Gender Lens: The Economic Security of Women and Girls in Forsyth County, 2015
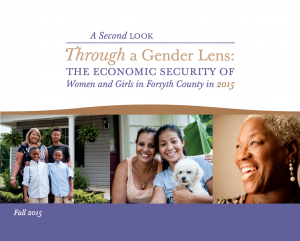
Produced by The Women’s Fund of the Winston-Salem Foundation.
In 2010, The Women’s Fund published a report on women and girls in our community — the first time that data on the lives of more than half of our population had ever been assembled. That report, Through a Gender Lens: The Economic Security of Women and Girls in Forsyth County, told us a great deal about work, wages, poverty, education, and healthcare at the time, and women’s strengths overall and challenges they face. Women in our community were resilient, but too many were living without the financial resources they needed for a safe and secure life for themselves and for their children. We resolved to do better.
The Forsyth Promise Education Report for Forsyth County, 2014
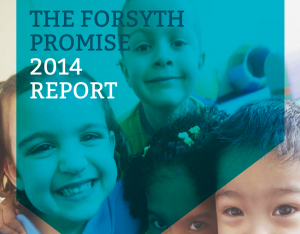
Produced by The Forsyth Promise.
The Forsyth Promise, a broad-based community partnership, wants to see every child in Forsyth County educated, equipped, and engaged from cradle to career. We want every child to receive the best education possible and be prepared to thrive throughout life. The information in this report provides a snapshot of our children’s educational outcomes at this moment in time as they make the journey from birth to young adulthood. We are inviting the entire community to work together to improve the educational and social outcomes for every child in Forsyth County.
Making Progress Report: Children Ready for School, 2013
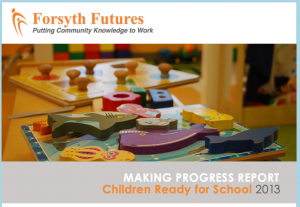
Produced by Forsyth Futures, 2013.
The Making Progress Report: Children Ready for School is part of the Educational Success sector. The following report provides a description of the children ready for school indicator, identifies measures of readiness, and establishes benchmarks for continuing to make progress in Forsyth County.
Community Research Framework
Individual Forsyth Futures reports are generally written to provide focused information on specific issues to inform community action. While these topics are generally measured in separate reports for clarity, it is important to acknowledge that all of the local issues we study are interconnected. For example, food insecurity is generally measured separately from reading proficiency scores, but in reality being a part of a family experiencing food insecurity can have a significant impact on children’s ability to learn and be successful in school.
Two Complementary Frameworks
To guide our reporting as we navigate this complexity, Forsyth Futures uses two frameworks which consider interconnected topical dimensions and dimensions of context and scale, respectively. Taken together, these two frameworks provide an opportunity for community stakeholders to consider how issues that appear separate in their reporting may be interconnected.

Interconnected Topical Dimensions
This framework model shows that despite how topics are separated to make information easier to access and communicate, many of the sectors that we study are interconnected, like a student’s economic stability and their ability to be successful in school.
Built and Physical Environment
Economy and Financial Stability
Education
Health and Wellness
Safety
Social and Civic Environment

Dimensions of Context and Scale
This framework model is based on a commonly-used social determinants of health model called the Social-Ecological model. This model illustrates how individuals and families are impacted by the broader contexts in which they exist. For example, an individual child’s test score measures their reading proficiency at the individual level, but it is important to acknowledge the impact that a child’s family, neighborhood, and school have on the child’s success.