
Community Data
Health and Wellness
Reliable local data encourages and supports data-informed decision making by community stakeholders at all levels. This information is designed to simplify the process of using data to inform the work that moves our community forward — program planning and evaluation, funding and resource allocation, grant writing, and more. If you have questions, please contact info@forsythfutures.org.
Key Measures
Key Measures help us better understand how our community is changing over time.
If you have questions, please contact info@forsythfutures.org.
Infant Mortality
Infant health is often a leading indicator of not only the overall health of children but also of a community’s health[1]. One measure of infant health in a community is the infant mortality rate. Infant mortality rate refers to the number of deaths per 1,000 live births of children under one year of age.
- Kim, D., & Saada, A. (2013). The social determinants of infant mortality and birth outcomes in Western developed nations: a cross-country systematic review. International journal of environmental research and public health, 10(6), 2296-2335.
The infant mortality rate has remained relatively stable over time in Forsyth County. The rate ranged from approximately 6 to 10 deaths per 1,000 live births from 2010-2020.
The infant mortality rate across comparison communities was similar in 2020.
Disparities were present in the infant mortality rate for African American residents and White residents in 2020. The infant mortality rate for White residents was 4 deaths per 1,000 live births compared to about 12 deaths per 1,000 live births for African American residents. The difference in infant mortality rates between Hispanic and White residents was not statistically significant.
Data Sources
- NC Department of Health and Human Services. (2021, September 9). Infant Mortality Statistics 2020. Retrieved from https://schs.dph.ncdhhs.gov/data/vital.cfm
If you are interested in using data from this report for rigorous purposes (such as program planning), please contact info@forsythfutures.org for a consultation on how best to proceed.
Low Birthweight
Infant health is often a leading indicator of not only the overall health of children, but also of a community’s health. Infant health is associated with factors like maternal health, quality of and access to medical care, socioeconomic conditions, and public health practices[1]. One measure in determining overall infant health is the percent of low-birthweight babies born in a particular area. Infants born weighing under 2,500 grams (5 pounds, 8 ounces) are considered low-birthweight babies.
- Kim, D., & Saada, A. (2013). The social determinants of infant mortality and birth outcomes in Western developed nations: a cross-country systematic review. International journal of environmental research and public health, 10(6), 2296-2335.
The percentage of babies with a low-birthweight has remained stable in Forsyth County ranging from 10 to 11% from 2010 to 2021.
The percentage of babies with a low-birthweight was lowest among mothers between the ages of 25 and 34. About 9% of mothers 25 to 29 years old and 30 to 34 years old, respectively, had a low-birthweight baby in 2021 compared to 13% of mothers 20 years old and younger.
Comparison communities had similar rates of low-birthweight, but the percentage of babies with a low-birthweight in the state was 9% in 2021 compared to 11% in Forsyth and Guilford County.
Rates of low birthweight were lower for mothers with higher levels of educational attainment. In 2021, mothers with at least a Bachelor’s Degree had lower low-birthweight rates than mothers with less than a Bachelor’s Degree.
There were disparities in low birthweight rates by race/ethnicity. African American residents had a higher low-birthweight rate compared to White and Hispanic/Latino residents.
Unknown birth weights were excluded from analyses.
Data Sources
- NC Department of Health and Human Services. (2022, September 30). Baby Book Data (State of North Carolina 2021) Retrieved from https://schs.dph.ncdhhs.gov/data/vital/babybook/2021.htm
If you are interested in using data from this report for rigorous purposes (such as program planning), please contact info@forsythfutures.org for a consultation on how best to proceed.
Life Expectancy
Life expectancy is the average number of additional years that someone at a given age is expected to live[1]. Life expectancy is impacted by several factors including genetics, predisposed health conditions, living standard, and access to adequate healthcare[2-3]. Increased life expectancy can be attributed to higher educational attainment, rising living standards and improved health care access[2].
The life expectancy dashboard shows approximate life expectancy at birth.
- NC Department of Health and Human Services. (2020, December 16). Life Expectancy: North Carolina 1990-1992 and 2017-2019, State and County. https://schs.dph.ncdhhs.gov/data/lifexpectancy/
- OECDiLibrary (n.d.). Health Status: Life Expectancy at Birth. https://www.oecd-ilibrary.org/social-issues-migration-health/life-expectancy-at-birth/indicator/english_27e0fc9d-en
- World Health Organization (2014, March). WHO methods for life expectancy and healthy life expectancy. http://www.who.int/healthinfo/statistics/LT_method_1990_2012.pdf?ua=1
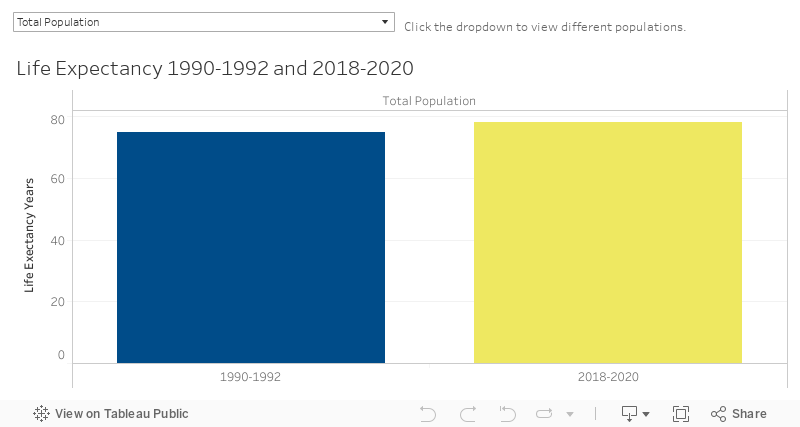
Life expectancy has increased from 1992-1994 to 2018-2020.
Forsyth County residents have a life expectancy of 78 years which is on par with Guilford County. Durham County had a life expectancy of 80 years, while North Carolina’s was 77.
Females have a significantly higher life expectancy than males. In Forsyth County, the life expectancy for females was 80 from 2018-2020 compared to 75 for males.
African Americans have a lower life expectancy than their White counterparts. White residents have a life expectancy 4 years higher than African American residents.
Data sources
- NC Department of Health and Human Services. (2022, March 7). Life Expectancy: North Carolina 1990-1992 and 2018-2020, State and County. Retrieved from https://schs.dph.ncdhhs.gov/data/lifexpectancy/.
If you are interested in using data from this report for rigorous purposes (such as program planning), please contact info@forsythfutures.org for a consultation on how best to proceed.
Drug Poisoning Deaths
Abuse of either legal or illegal drugs is referred to as substance abuse. Substance abuse negatively affects a person’s nutrition, their decision-making and impulsivity, and puts them at a higher risk of exposure to trauma, violence, injury, and death[3]. Drug poisoning deaths are recorded for any unintentional drug-induced death[1]. Drug addiction and overdose presents an extensive health crisis throughout the United States[2]. Nationally, unintentional drug poisoning (both pharmaceutical and illicit) is the leading cause of all unintentional injury deaths[4].
Deaths due to drug poisoning represent the number of unintentional deaths due to drug poisoning per 100,000 persons. To ensure comparison of standard populations, all rates given are age-adjusted.
- Centers for Disease Control and Prevention (CDC). (2021, December 22). Underlying Cause of Death 1999-2020.https://wonder.cdc.gov/wonder/help/ucd.html
- Wilson, N. (2020). Drug and opioid-involved overdose deaths—United States, 2017–2018. MMWR. Morbidity and Mortality Weekly Report, 69.
- National Institute on Drug Abuse. (2020, August 20). Commonly Used Drugs Charts. https://www.drugabuse.gov/drug-topics/health-consequences-drug-misuse/introduction
- Centers for Disease Control and Prevention (CDC). (2020, February 20). WISQARS: Leading cause of death reports, 2019. wisqars.cdc.gov

1-Year Data
From 2006 to 2020, drug poisoning deaths in Forsyth County tripled, from approximately 11 deaths per 100,000 to about 34 deaths per 100,000. Rates also significantly increased across both comparison counties and the state in that same time period.
In 2020, there were no significant differences between Forsyth County, Guilford County, and the state of North Carolina. Durham County had a much lower drug poisoning rate than Forsyth County.
5-Year Data
Males experienced more than twice as many drug poisoning deaths as females from 2016 to 2020.
White residents had double the amount of drug poisoning deaths as Black or African American residents from 2016 to 2020.
1-Year Data
Due to the CDC’s WONDER data set privacy policies, some of the yearly estimates at the county level were excluded.
5-Year Data
Individual yearly estimates by race/ethnicity and gender were omitted by CDC WONDER due to privacy policies. 5 year estimates (2016-2020) are used instead to compare estimates for males to females and Black or African-Americans to White residents. Hispanic/Latino residents were excluded from the 5 year estimates due to the unreliability of the estimates.
Data Sources
- Centers for Disease Control and Prevention, National Center for Health Statistics. Underlying Cause of Death 1999-2020 on CDC WONDER Online Database, released in 2021. Data are from the Multiple Cause of Death Files, 1999-2020, as compiled from data provided by the 57 vital statistics jurisdictions through the Vital Statistics Cooperative Program. Accessed at http://wonder.cdc.gov/ucd-icd10.html on Dec 27, 2021.
If you are interested in using data from this report for rigorous purposes (such as program planning), please contact info@forsythfutures.org for a consultation on how best to proceed.
Accidental Death
Accidents or unintentional injuries are the third leading cause of death in the United States[1]. The three largest causes of deaths due to unintentional injuries are motor vehicle, drug poisoning, and falling accidents with drug poisoning deaths accounting for the largest rate of death per 100,000 people. Nationally, accidental deaths have increased significantly since the 1990s especially motor vehicle traffic deaths and unintentional drug overdoses[2].
For this report, accidental death is calculated as a rate expressed as resident deaths per 100,000 people. To ensure comparison of standard populations, all rates given are age-adjusted.
- Centers for Disease Control and Prevention (CDC), National Center for Health Statistics. (2021, October 19). Accidents or Unintentional Injuries. https://www.cdc.gov/nchs/fastats/accidental-injury.htm
- Olaisen, R. H., Rossen, L. M., Warner, M., & Anderson, R. N. (2019). Unintentional injury death rates in rural and urban areas: United States, 1999–2017. NCHS Data Brief, no. 343. Hyattsville, MD: National Center for Health Statistics.
Rates of accidental death were higher in recent years. In 2020, Forsyth County had approximately 76 accidental deaths per every 100,000 residents, compared to 33 deaths per 100,000 in 2006.
Forsyth County had higher accidental death rates than Durham County. The accidental death rate in Durham County was about 57 per every 100,000 residents which is almost 20 deaths per 100,000 residents fewer than Forsyth County’s rate.
Accidental death rates were highest for residents 65 and older.
Disparities were present in accidental death rates by gender. Males consistently had a higher rate of accidental death than females across all years.
Disparities were present in accidental death rates by race/ethnicity. White residents had a significantly higher rate of accidental death compared to Black or African American residents.
Age categories reflect collapsed age groups from CDC WONDER. Due to CDC WONDER’s privacy policies, some of the age groups’ yearly estimates were excluded in 2006 and 2008-2011. Additionally, the 2008 estimate for Black or African American residents was excluded due to privacy policies.
Data Sources
- Centers for Disease Control and Prevention, National Center for Health Statistics. Underlying Cause of Death 1999-2020 on CDC WONDER Online Database, released in 2021. Data are from the Multiple Cause of Death Files, 1999-2020, as compiled from data provided by the 57 vital statistics jurisdictions through the Vital Statistics Cooperative Program. Accessed at http://wonder.cdc.gov/ucd-icd10.html on Dec 27, 2021.
If you are interested in using data from this report for rigorous purposes (such as program planning), please contact info@forsythfutures.org for a consultation on how best to proceed.
Key Measures
Key Measures help us better understand how our community is changing over time.
If you have questions, please contact info@forsythfutures.org.
Infant Mortality
About
Infant health is often a leading indicator of not only the overall health of children but also of a community’s health[1]. One measure of infant health in a community is the infant mortality rate. Infant mortality rate refers to the number of deaths per 1,000 live births of children under one year of age.
- Kim, D., & Saada, A. (2013). The social determinants of infant mortality and birth outcomes in Western developed nations: a cross-country systematic review. International journal of environmental research and public health, 10(6), 2296-2335.
Data
Key Points
The infant mortality rate has remained relatively stable over time in Forsyth County. The rate ranged from approximately 6 to 10 deaths per 1,000 live births from 2010-2020.
The infant mortality rate across comparison communities was similar in 2020.
Disparities were present in the infant mortality rate for African American residents and White residents in 2020. The infant mortality rate for White residents was 4 deaths per 1,000 live births compared to about 12 deaths per 1,000 live births for African American residents. The difference in infant mortality rates between Hispanic and White residents was not statistically significant.
Data Notes
Data Sources
- NC Department of Health and Human Services. (2021, September 9). Infant Mortality Statistics 2020. Retrieved from https://schs.dph.ncdhhs.gov/data/vital.cfm
If you are interested in using data from this report for rigorous purposes (such as program planning), please contact info@forsythfutures.org for a consultation on how best to proceed.
Low Birthweight
About
Infant health is often a leading indicator of not only the overall health of children, but also of a community’s health. Infant health is associated with factors like maternal health, quality of and access to medical care, socioeconomic conditions, and public health practices[1]. One measure in determining overall infant health is the percent of low-birthweight babies born in a particular area. Infants born weighing under 2,500 grams (5 pounds, 8 ounces) are considered low-birthweight babies.
- Kim, D., & Saada, A. (2013). The social determinants of infant mortality and birth outcomes in Western developed nations: a cross-country systematic review. International journal of environmental research and public health, 10(6), 2296-2335.
Data
Key Points
The percentage of babies with a low-birthweight has remained stable in Forsyth County ranging from 10 to 11% from 2010 to 2021.
The percentage of babies with a low-birthweight was lowest among mothers between the ages of 25 and 34. About 9% of mothers 25 to 29 years old and 30 to 34 years old, respectively, had a low-birthweight baby in 2021 compared to 13% of mothers 20 years old and younger.
Comparison communities had similar rates of low-birthweight, but the percentage of babies with a low-birthweight in the state was 9% in 2021 compared to 11% in Forsyth and Guilford County.
Rates of low birthweight were lower for mothers with higher levels of educational attainment. In 2021, mothers with at least a Bachelor’s Degree had lower low-birthweight rates than mothers with less than a Bachelor’s Degree.
There were disparities in low birthweight rates by race/ethnicity. African American residents had a higher low-birthweight rate compared to White and Hispanic/Latino residents.
Data Notes
Unknown birth weights were excluded from analyses.
Data Sources
-
- NC Department of Health and Human Services. (2022, September 30). Baby Book Data (State of North Carolina 2021) Retrieved from https://schs.dph.ncdhhs.gov/data/vital/babybook/2021.htm
If you are interested in using data from this report for rigorous purposes (such as program planning), please contact info@forsythfutures.org for a consultation on how best to proceed.
Life Expectancy
About
Life expectancy is the average number of additional years that someone at a given age is expected to live[1]. Life expectancy is impacted by several factors including genetics, predisposed health conditions, living standard, and access to adequate healthcare[2-3]. Increased life expectancy can be attributed to higher educational attainment, rising living standards and improved health care access[2].
The life expectancy dashboard shows approximate life expectancy at birth.
-
- NC Department of Health and Human Services. (2020, December 16). Life Expectancy: North Carolina 1990-1992 and 2017-2019, State and County. https://schs.dph.ncdhhs.gov/data/lifexpectancy/
- OECDiLibrary (n.d.). Health Status: Life Expectancy at Birth. https://www.oecd-ilibrary.org/social-issues-migration-health/life-expectancy-at-birth/indicator/english_27e0fc9d-en
- World Health Organization (2014, March). WHO methods for life expectancy and healthy life expectancy. http://www.who.int/healthinfo/statistics/LT_method_1990_2012.pdf?ua=1
Data
Key Points
Life expectancy has increased from 1992-1994 to 2018-2020.
Forsyth County residents have a life expectancy of 78 years which is on par with Guilford County. Durham County had a life expectancy of 80 years, while North Carolina’s was 77.
Females have a significantly higher life expectancy than males. In Forsyth County, the life expectancy for females was 80 from 2018-2020 compared to 75 for males.
African Americans have a lower life expectancy than their White counterparts. White residents have a life expectancy 4 years higher than African American residents.
Data Notes
Data Sources
- NC Department of Health and Human Services. (2022, March 7). Life Expectancy: North Carolina 1990-1992 and 2018-2020, State and County. Retrieved from https://schs.dph.ncdhhs.gov/data/lifexpectancy/.
If you are interested in using data from this report for rigorous purposes (such as program planning), please contact info@forsythfutures.org for a consultation on how best to proceed.
Drug Poisoning Deaths
About
Abuse of either legal or illegal drugs is referred to as substance abuse. Substance abuse negatively affects a person’s nutrition, their decision-making and impulsivity, and puts them at a higher risk of exposure to trauma, violence, injury, and death[3]. Drug poisoning deaths are recorded for any unintentional drug-induced death[1]. Drug addiction and overdose presents an extensive health crisis throughout the United States[2]. Nationally, unintentional drug poisoning (both pharmaceutical and illicit) is the leading cause of all unintentional injury deaths[4].
Deaths due to drug poisoning represent the number of unintentional deaths due to drug poisoning per 100,000 persons. To ensure comparison of standard populations, all rates given are age-adjusted.
- Centers for Disease Control and Prevention (CDC). (2021, December 22). Underlying Cause of Death 1999-2020.https://wonder.cdc.gov/wonder/help/ucd.html
- Wilson, N. (2020). Drug and opioid-involved overdose deaths—United States, 2017–2018. MMWR. Morbidity and Mortality Weekly Report, 69.
- National Institute on Drug Abuse. (2020, August 20). Commonly Used Drugs Charts. https://www.drugabuse.gov/drug-topics/health-consequences-drug-misuse/introduction
- Centers for Disease Control and Prevention (CDC). (2020, February 20). WISQARS: Leading cause of death reports, 2019. wisqars.cdc.gov
1-year Data
5-year Data
Key Points
1-Year Data
From 2006 to 2020, drug poisoning deaths in Forsyth County tripled, from approximately 11 deaths per 100,000 to about 34 deaths per 100,000. Rates also significantly increased across both comparison counties and the state in that same time period.
In 2020, there were no significant differences between Forsyth County, Guilford County, and the state of North Carolina. Durham County had a much lower drug poisoning rate than Forsyth County.
5-Year Data
Males experienced more than twice as many drug poisoning deaths as females from 2016 to 2020.
White residents had double the amount of drug poisoning deaths as Black or African American residents from 2016 to 2020.
Data Notes
1-Year Data
Due to the CDC’s WONDER data set privacy policies, some of the yearly estimates at the county level were excluded.
5-Year Data
Individual yearly estimates by race/ethnicity and gender were omitted by CDC WONDER due to privacy policies. 5 year estimates (2016-2020) are used instead to compare estimates for males to females and Black or African-Americans to White residents. Hispanic/Latino residents were excluded from the 5 year estimates due to the unreliability of the estimates.
Data Sources
- Centers for Disease Control and Prevention, National Center for Health Statistics. Underlying Cause of Death 1999-2020 on CDC WONDER Online Database, released in 2021. Data are from the Multiple Cause of Death Files, 1999-2020, as compiled from data provided by the 57 vital statistics jurisdictions through the Vital Statistics Cooperative Program. Accessed at http://wonder.cdc.gov/ucd-icd10.html on Dec 27, 2021.
If you are interested in using data from this report for rigorous purposes (such as program planning), please contact info@forsythfutures.org for a consultation on how best to proceed.
Additional Measures
Additional Measures are less detailed than key measures and are intended to provide additional context for community uses such as grant writing and program planning.
If you have questions, please contact info@forsythfutures.org.
Adult Health
| Year | Rate | Source | Geography | |
|---|---|---|---|---|
| Percentage of adults who report their health to be poor or fair | 2023 | 13% | County Health Rankings | Forsyth County |
| Average number of poor physical health days reported by adults in past 30 days | 2023 | 2.9 days | County Health Rankings | Forsyth County |
| Average number of poor mental health days reported by adults in past 30 days | 2023 | 4.4 days | County Health Rankings | Forsyth County |
| Adult obesity | 2023 | 33% | County Health Rankings | Forsyth County |
| Adult smoking | 2023 | 17% | County Health Rankings | Forsyth County |
| Percentage of adults who visited a dentist or dental clinic | 2020 | 65% | CDC/500 Cities: Local Data for Better Health, 2017 release | Forsyth County |
| Percentage of adults reporting no leisure-time physical activity | 2023 | 21% | County Health Rankings | Forsyth County |
| Health Insurance — Rate of uninsured individuals | 2020 | 12% | U.S. Census Bureau/Small Area Health Insurance Estimates (SAHIE) | Forsyth County |
Various indicators of adult (individuals 18 years and older) health for various years, updated in 2023.
Data Sources
Data sources are listed in the table.
Youth Behavioral Health
| Alcohol, Tobacco & Other Drug Use | Percentage |
|---|---|
| Offered, Sold, or Given an Illegal Drug on School Property in Past 30 Days | 23% |
| Used Marijuana ≥ 1 Times in the Past 30 Days | 19% |
| Currently Binge Drink (Had ≥ 5 Drinks of Alcohol in a Row in a Couple Hours on ≥ 1 Days in the Past 30 Days) | 9% |
| Currently Drink Alcohol (Drink of Alcohol on ≥ 1 Days in the Past 30 days) | 20% |
| Currently Use Electronic Vapor Products on ≥ 1 Day in the Past 30 | 28% |
| Currently Smoke Cigarettes (Smoked Cigarettes on ≥ 1 Days in the Past 30 Days) | 8% |
| Ever Sniffed Chemicals (such as Glue or Paint) to Get a High | 8% |
| Ever Taken Drugs (such as OxyContin, Vicodin or Codeine) that were Not Prescribed for Them | 18% |
| Psychological Health | Percentage |
| Felt Sad or Hopeless Continuously for Two Weeks or More in the Past 12 Months | 35% |
| Seriously Considered Attempting Suicide During the Past 12 Months | 20% |
| Made a Suicide Plan During the Past 12 Months | 15% |
| Attempted Suicide During the Past 12 Months | 4% |
Various measures of child health based on the Winston Salem/Forsyth County High School Youth Risk Behavior Survey.
Data Sources
- Forsyth County Department of Public Health, Epidemiology & Surveillance Unit. (2020, August). 2019 Winston Salem/Forsyth County High School Youth Risk Behavior Survey Results. Retrieved from https://www.forsyth.cc/PublicHealth/assets/documents/2019_WSFCS_YRBS_Highlights.pdf
Births by Race/Ethnicity and Education Level of Mother
| White, non-Hispanic | African American, non-Hispanic | Other, non-Hispanic | Hispanic/Latino | Total | |
|---|---|---|---|---|---|
| Less than HIgh School | 95 | 119 | 21 | 371 | 606 |
| HS Graduation or GED | 274 | 409 | 26 | 299 | 1008 |
| Some College | 581 | 517 | 25 | 175 | 1298 |
| College Degree (Bachelor's, Master's, PhD) | 95 | 234 | 90 | 101 | 1370 |
| Unknown | 0 | 4 | 2 | 2 | 8 |
| 2020 Forsyth Totals | 1895 | 1283 | 164 | 948 | 4290 |
| Percent White, non-Hispanic | Percent African American, non-Hispanic | Percent Other, non-Hispanic | Percent Hispanic/Latino | Percent Total | |
|---|---|---|---|---|---|
| Less than HIgh School | 5% | 9% | 13% | 39% | 14% |
| HS Graduation or GED | 15% | 32% | 16% | 32% | 24% |
| Some College | 31% | 40% | 15% | 19% | 30% |
| College Degree (Bachelor's, Master's, PhD) | 50% | 18% | 55% | 11% | 32% |
| Unknown | 0% | 0% | 1% | 0% | 0% |
| 2020 Forsyth Totals | 44% | 30% | 4% | 22% | 100% |
Data Sources
- NC Department of Health and Human Services (NC DHHS). (2022). Forsyth County Resident Births for 2020 Risk Factors and Characteristics. Retrieved from https://schs.dph.ncdhhs.gov/data/databook/BirthIndicators-CHDB22/Forsyth.pdf
Mothers and Children
| Measure | Year | Rate or Percentage | Source |
|---|---|---|---|
| Adolescent Pregnancy Rate Among Females Ages 15 to 17 | 2016-2020 | 11.6 | NC State Center for Health Statistics, 2022 County Health Data Book, 2016-2020 Pregnancy Rates per 1,000 Population |
| Adolescent Pregnancy Rate Among Females Ages 15 to 19 | 2016-2020 | 23.4 | NC State Center for Health Statistics, 2022 County Health Data Book, 2016-2020 Pregnancy Rates per 1,000 Population |
| Infant Mortality Rate | 2020 | 7.2 | NC Department of Health & Human Services State Center for Health Statistics, Infant Mortality Rates per 1,000 Births |
| Percent of Children Ages 1-2 with Elevated Blood Lead Levels >= 5 | 2019 | 1.1% | Kids Count Data Center/ NC Department of Health & Human Services, Children’s Environmental Health Section: Childhood Lead Poisoning Prevention Program Surveillance Data |
Measures for mothers and children, updated November 2022.
Data Sources
Data sources are listed in the table.
Death and Disease
| Rate per 100,000 | |
|---|---|
| Age-Adjusted Cardiovascular Disease Death Rate | 205.6 |
| Age-Adjusted Heart Disease Death Rate | 146.7 |
| Age-Adjusted Stroke Death Rate | 43.6 |
| Age-Adjusted Diabetes Death Rate | 22.8 |
| Age-Adjusted Colorectal Cancer Death Rate | 12.8 |
| Age-Adjusted Trachea, Bronchus & Lung Cancer Death Rate | 47.4 |
| Age-Adjusted Female Breast Cancer Incidence Rate | 176.6 |
| Age-Adjusted Prostate Cancer Incidence Rate | 127.2 |
| Age-Adjusted Unintentional Motor Vehicle Injury Death Rate | 11.3 |
| Age-Adjusted Unintentional Injury Death Rate (excluding Motor Vehicle Deaths) | 36.4 |
| Age-Adjusted Homicide Rate | 6.3 |
| Age-Adjusted Suicide Rate | 11.2 |
Data Sources
- NC Department of Health and Human Services, NC County Trends Reports, February 2019. North Carolina Statewide and County Trends in Key Health Indicators: Forsyth County. Data Year: 2013-2017 _5-year estimates).
Leading Causes of Death
| Deaths (2016-2020) | Age-Adjusted Death Rate per 100,000 | |
|---|---|---|
| All Causes | 17,903 | 801.6 |
| Cancer | 3,597 | 156.3 |
| Diseases of Heart | 3,357 | 147.2 |
| All Other Unintentional Injuries | 1,003 | 50.5 |
| Cerebrovascular Disease | 989 | 43.6 |
| Chronic Lower Respiratory Diseases | 987 | 42.6 |
| Alzheimer's disease | 894 | 39.7 |
| Diabetes Mellitus | 542 | 23.6 |
| Nephritis, Nephrotic Syndrome, and Nephrosis | 393 | 17.1 |
| Pneumonia and Influenza | 362 | 15.9 |
| Septicemia | 304 | 13.5 |
Data Sources
- NC Department of Health and Human Services. (2022, April 20). 2016-2020 Race-Sex-Specific Age-Adjusted Death Rates by County. Retrieved from https://schs.dph.ncdhhs.gov/data/databook/
Mortality Rate
Deaths: 3,973
Age-Adjusted Rate per 100,000: 859.4
Data Sources
- Centers for Disease Control and Prevention, National Center for Health Statistics. Underlying Cause of Death 1999-2020 on CDC WONDER Online Database, released in 2021. Data are from the Multiple Cause of Death Files, 1999-2020, as compiled from data provided by the 57 vital statistics jurisdictions through the Vital Statistics Cooperative Program. Accessed at http://wonder.cdc.gov/ucd-icd10.html on November 21, 2022.
Reports and Briefings
This section contains various reports that are relevant to the health and wellness of our community. Listed reports may have been produced by Forsyth Futures or others in the community.
If you have questions, please contact info@forsythfutures.org.
Through a Gender Lens: The Economic Security of Women and Girls in Forsyth County, 2020

Produced by The Women’s Fund of the Winston-Salem Foundation in partnership with Forsyth Futures.
After seeing the importance of highlighting data that focused on the economic security of women and girls in Forsyth County, The Women’s Fund committed to producing a report of its nature every five years. While we chose a print format for our two previous reports, we decided to take a different approach with our third Through a Gender Lens report by presenting it as an interactive microsite with the goal to make the information more accessible and engaging.
Key Measures Report, 2020
Produced by Forsyth Futures.
Forsyth Futures’ Key Measures Report serves as a compilation of recent, commonly-requested, community-specific, reference information to aid informed public consideration and grant-writing activities in Forsyth County. The contents of this report address demographics and various topics related to the economy, health and wellness, education, and safety in Forsyth County.
A Second Look Through a Gender Lens: The Economic Security of Women and Girls in Forsyth County, 2015
Produced by The Women’s Fund of the Winston-Salem Foundation.
In 2010, The Women’s Fund published a report on women and girls in our community — the first time that data on the lives of more than half of our population had ever been assembled. That report, Through a Gender Lens: The Economic Security of Women and Girls in Forsyth County, told us a great deal about work, wages, poverty, education, and healthcare at the time, and women’s strengths overall and challenges they face. Women in our community were resilient, but too many were living without the financial resources they needed for a safe and secure life for themselves and for their children. We resolved to do better.
Understanding Access to Healthcare, 2014

Produced by Forsyth Futures, 2014.
With the implementation of the Affordable Care Act (ACA) health care in the United States is going through a transition. Understanding what primary health care resources are available in Forsyth County, and residents ability to access these resources can help community leaders plan for the transition. The purpose of the study Understanding Access to Health Care, is to provide an overview of health care resources and access to those resources before ACA was implemented. With support from HealthCare Access and the Kate B. Reynolds Charitable Trust, Forsyth Futures conducted an objective assessment of access to health care in Forsyth County.
Emergency Food Assistance Efforts in Forsyth County, 2014
Produced by Forsyth Futures, 2014
An Initiascape provides a map of the landscape of our community’s efforts about a particular initiative. It also serves as a resource directory of those programs that are connected through a common initiative. Initiascapes are designed to increase opportunities for collaboration and cooperation in order to more efficiently use our community’s resources. This Initiascape study about Emergency Food Assistance is designed to help connect the community “dots” of those who provide emergency food assistance in Forsyth County.
Community Research Framework
Individual Forsyth Futures reports are generally written to provide focused information on specific issues to inform community action. While these topics are generally measured in separate reports for clarity, it is important to acknowledge that all of the local issues we study are interconnected. For example, food insecurity is generally measured separately from reading proficiency scores, but in reality being a part of a family experiencing food insecurity can have a significant impact on children’s ability to learn and be successful in school.
Two Complementary Frameworks
To guide our reporting as we navigate this complexity, Forsyth Futures uses two frameworks which consider interconnected topical dimensions and dimensions of context and scale, respectively. Taken together, these two frameworks provide an opportunity for community stakeholders to consider how issues that appear separate in their reporting may be interconnected.

Interconnected Topical Dimensions
This framework model shows that despite how topics are separated to make information easier to access and communicate, many of the sectors that we study are interconnected, like a student’s economic stability and their ability to be successful in school.
Built and Physical Environment
Economy and Financial Stability
Education
Health and Wellness
Safety
Social and Civic Environment

Dimensions of Context and Scale
This framework model is based on a commonly-used social determinants of health model called the Social-Ecological model. This model illustrates how individuals and families are impacted by the broader contexts in which they exist. For example, an individual child’s test score measures their reading proficiency at the individual level, but it is important to acknowledge the impact that a child’s family, neighborhood, and school have on the child’s success.