
Community Data
Economy and Financial Stability
Reliable local data encourages and supports data-informed decision making by community stakeholders at all levels. This information is designed to simplify the process of using data to inform the work that moves our community forward — program planning and evaluation, funding and resource allocation, grant writing, and more. If you have questions, please contact info@forsythfutures.org.
Key Measures
Key Measures help us better understand how our community is changing over time.
If you have questions, please contact info@forsythfutures.org.
Employment
Employment rates play a significant role in understanding our local economy. The employment rates presented here represent the percentage of the population that is at least 16 years old and employed for the total population and for all demographic breakdowns except sex. The employment rate by sex represents those that are between the ages of 20 to 64. Following a recession, the employment rate tends to not grow to any significant extent until the remainder of the economy has recovered, making it a lagging indicator [1].
- Pew Charitable Trust. (2013). Hard choices navigating the economic shock of unemployment. Retrieved from http://www.pewtrusts.org/~/media/legacy/uploadedfiles/pcs_assets/2013/empreportoverviewhardchoicesnavigatingtheeconomicshockofunemploymentpdf.pdf
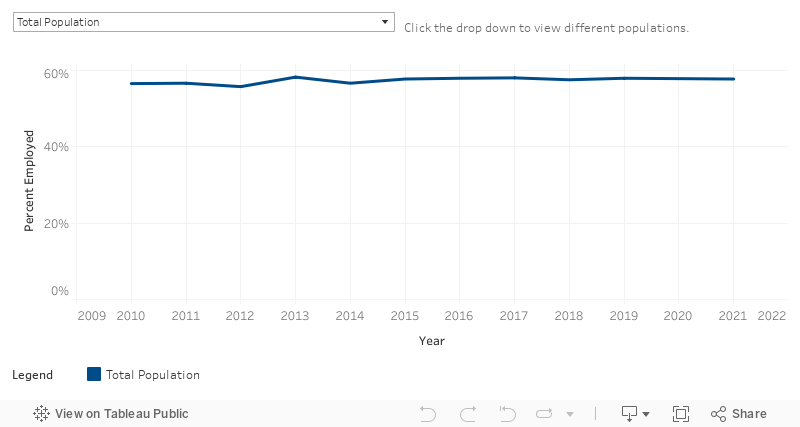
The employment rate remained relatively stable in Forsyth County from 2010-2021.
All comparison communities’ employment rate ranged from 57% to 62% in 2021. The employment rate in Forsyth County was 58% which was 4% lower than Durham County’s and 3% lower than Guilford County’s employment rate.
Disparities were present in employment rates for residents by age. In 2021, Forsyth County residents between the ages of 25 and 44 had an employment rate of 79% compared to 44% of 16 to 24 year olds and 70% of 45 to 64 year olds.
Disparities were present in employment rates for residents by sex for most years. The employment rate for male workers was consistently higher than the employment rate for female workers from 2010 to 2019. In 2021, the gap is smaller and within the margins of error, so analysts cannot be confident that the employment rates of males and females are different.
The employment rate in 2021 was similar for Black or African American and non-Hispanic White residents. Black or African American respondents' lowest employment rate was at 49% in 2011 which increased to 57% in 2021 and is comparable to White residents' employment rate of 56% in 2021.
Due to pandemic disruptions, 2020 data is not comparable to previous years. To learn more about these disruptions click here.
The Census suppressed several Hispanic/Latino estimates due to the small sample sizes in particular years.
Data Sources
- U.S. Census Bureau (2022). Employment Status: Table S2301, 2006-2019 and 2021 American Community Survey 1-Year Estimates. Retrieved from data.census.gov.
- U.S. Census Bureau (2022). Employment Status: Table S2301, 2017-2021 American Community Survey 5-Year Estimates. Retrieved from data.census.gov.
If you are interested in using data from this report for rigorous purposes (such as program planning), please contact info@forsythfutures.org for a consultation on how best to proceed.
Homeownership
The homeownership rate describes the percent of households who own their home. Owning a home, or other assets such as savings accounts, investments, and vehicles provides financial security that can protect households from unexpected expenses and decrease the likelihood of experiencing poverty[1]. While homeownership rates do not indicate overall wealth, or even the value of homes, they do indicate ownership of a valuable asset, which could provide financial security[1].
When determining homeownership rates by age and race/ethnicity, this indicator only considers the age and race/ethnicity of the householder, who is the individual who filled out the Census Bureau’s American Community Survey.
- Cramer, R. & Shanks, T. (2014). The assets perspective: The rise of asset building and its impact on social policy. New York, NY: Palgrave Macmillan.
Homeownership rates in Forsyth County have ranged from 58% to 66% from 2006 to 2021. In 2021, the homeownership rate was 65% in the county.
Durham County had the lowest homeownership rate of all the comparison communities. In 2021, 55% of households in Durham County owned their own homes while 63% to 67% of households in the other comparison communities owned their own homes.
There are homeownership rate differences by age. Those under the age of 35 had the lowest homeownership rate among all age groups.
Racial and ethnic disparities in homeownership were large. White residents had consistently higher rates of homeownership compared to Black or African-American and Hispanic/Latino residents. In 2021, 74% of non-Hispanic White residents owned their homes compared to 48% of Black or African-American residents and 51% of Hispanic/Latino residents.
Due to pandemic disruptions, 2020 data is not comparable to previous years. To learn more about these disruptions click here.
Age Group: Due to the small sample size of 35 to 64 year olds and 65 years old and over in 2018,2019, and 2021 the estimates are not as reliable. Additionally, the estimate of those 65 years old and over in 2010 and those 15 to 34 years old in 2021 are not as reliable due to their small sample sizes and should be interpreted with caution.
Race/Ethnicity: With the exception of 2015, due to the small sample size of the Hispanic/Latino population, the homeownership rates for Hispanic/Latino residents are not as reliable.
Data Sources
- U.S. Census Bureau (2022). Tenure: Table B25003, 2006-2019 and 2021 American Community Survey 1-Year Estimates. Retrieved from data.census.gov.
- U.S. Census Bureau (2022). Tenure by Age of Householder: Table B25007, 2006-2019 and 2021 American Community Survey 1-Year Estimates. Retrieved from data.census.gov.
- U.S. Census Bureau (2022). Tenure (Black or African American Alone Householder): Table B25003B, 2006-2019 and 2021 American Community Survey 1-Year Estimates. Retrieved from data.census.gov.
- U.S. Census Bureau (2022). Tenure (Hispanic or Latino Householder): Table B25003I, 2006-2019 American and 2021 Community Survey 1-Year Estimates. Retrieved from data.census.gov.
- U.S. Census Bureau (2022). Tenure (White Alone, Not Hispanic or Latino Householder): Table B25003H, 2006-2019 and 2021 American Community Survey 1-Year Estimates. Retrieved from data.census.gov.
- U.S. Census Bureau (2022). Tenure: Table B25003, 2017-2021 American Community Survey 5-Year Estimates. Retrieved from data.census.gov.
If you are interested in using data from this report for rigorous purposes (such as program planning), please contact info@forsythfutures.org for a consultation on how best to proceed.
Housing Burden
When a significant portion of a household’s income is devoted to housing expenses, there is less money available to cover other basic needs such as food, health care, and transportation, a situation which may result in financial insecurity[1,2]. Housing cost burden measures housing expenses as a percentage of household income for homeowners and renters. The threshold for housing cost burden is when a household spends more than 30% of their income on housing expenses. Expenses include mortgage or rent payments, utilities, property taxes, insurance, and other fees.
- Cramer, R. & Shanks, T. (2014). The assets perspective: The rise of asset building and its impact on social policy. New York, NY: Palgrave Macmillan.
- Schwartz, M. & Wilson, E. (2007). Who can afford to live in a home?: A look at data from the 2006 American Community Survey. Retrieved from: https://www.census.gov/housing/census/publications/who-can-afford.pdf
Rates of housing burden rose significantly since 2007. Approximately, 40% of residents reported a housing cost burden in 2021 compared to 31% in 2007.
Forsyth County housing burden rates were higher than Durham County's rates.
Disparities were present in housing burden rates by age group in Forsyth County. Approximately 31% of residents between the ages of 25 to 44 were cost burdened compared to 52% of those under the age 25, 41% of those between the ages of 45 and 64, and 47% of those 65 years and older.
Race/Ethnicity: All estimates for Hispanic/Latino residents are not as reliable as the other race/ethnicity groups due to the small sample size of the population.
Age Group: All estimates for those 24 years old and younger are not as reliable as the other age groups due to the small sample size of the population.
Due to pandemic disruptions, 2020 data is not comparable to previous years.
Data Sources
- U.S. Census Bureau (2021). American Community Survey (ACS), 1-Year Public Use Microdata Sample (PUMS), 2007-2019 and 2021. Retrieved from Public Use Microdata Sample (PUMS).
If you are interested in using data from this report for rigorous purposes (such as program planning), please contact info@forsythfutures.org for a consultation on how best to proceed.
Income by Quintile
Changes in household incomes do not always happen uniformly for high-and low-income earners. For example, incomes could rise for high-earning households and stay the same or drop for lower-earning households.
Income quintiles help illuminate how much incomes are changing for high- versus low-income households in our community. Income quintiles are defined in percentiles using upper-limit thresholds. For example, in 2021, the 20th percentile quintile for Forsyth County had an upper limit of $23,970, meaning that the income of twenty percent of the population was less than $23,970. Due to the general nature of quintiles, income thresholds change from year to year.
| Percentile | Meaning | 2021 Income Level |
|---|---|---|
| 20th | 20% of households have income at or below this level | $23,970 |
| 40th | 40% of households have income at or below this level | $46,026 |
| 60th | 60% of households have income at or below this level | $75,559 |
| 80th | 80% of households have income at or below this level | $120,918 |
| 95th | 95% of households have income at or below this level | $235,564 |
Household income across the three lowest incomes in Forsyth County decreased significantly from 2010 to 2021. Residents in the 20th, 40th, and 60th percentiles had a decrease in their household income by approximately $4,000 to $5,830 from 2010 to 2021. For example, controlling for inflation, the lowest or 20th percentile quintile had a household income of $27,972 in 2010 compared to $23,970 which is a decrease of over $4,000.
Disparities were present in income percentiles by race/ethnicity. At the lower end of the income distribution, Black or African Americans were overrepresented and White, non-Hispanics were underrepresented. Conversely, at the higher end of the income distribution White, non-Hispanics are overrepresented and Black or African Americans and Hispanic/Latino residents were underrepresented.
All dollar amounts are expressed in 2021 dollars to control for inflation.
Due to pandemic disruptions, 2020 data is not comparable to previous years.
Data Sources
- U.S. Census Bureau (2021). Household Income Quintile Upper Limits: Table B19080, 2006-2019 and 2021 American Community Survey 1-Year Estimates. Retrieved from data.census.gov.
- U.S. Census Bureau (2021). American Community Survey (ACS), 1-Year Public Use Microdata Sample (PUMS), 2021. Retrieved from Public Use Microdata Sample (PUMS).
If you are interested in using data from this report for rigorous purposes (such as program planning), please contact info@forsythfutures.org for a consultation on how best to proceed.
Median Income
Access to adequate financial resources is necessary for economic self-sufficiency. Median household income is an indicator of the financial resources available to middle-income households in our community. Median household income refers to the specific income level that is below the highest-earning 50% of households and above the lowest-earning 50% of households. Because income is closely tied to poverty, the Census Bureau and other studies use household income to determine poverty status[1,2].
- Kushel, M., Gupta, R., Gee, L., & Haas, J. (2006). Housing instability and food security as barriers to health care among low-income Americans. Journal of General Internal Medicine, 21(1), 71-77. doi: 1111/j.1525-1497.2005.00278.x
- S. Census Bureau, Poverty thresholds by size of family and number of children. (2017). Retrieved from https://www.census.gov/data/tables/time-series/demo/income-poverty/historical-poverty-thresholds.html
The median household income in Forsyth County was $59,879 in 2021. The median household income in 2021 was approximately $4,745 to $5,862 higher than the median household income in 2019 and 2018, respectively.
The median household income in Forsyth County was significantly lower than the national average from 2010 to 2021. The median national income was approximately $9,838 higher than Forsyth County’s median income in 2021. Also, in 2021 the median income was significantly higher in Durham County than in Forsyth County.
Householders between the ages of 25 to 44 and 45 to 64 had significantly higher median incomes than those under the age of 25 and those over the age of 65.
There were no significant differences between the median household income of residents with children present in the home than those without children present. While the estimate for households without a child present is slightly higher than households with a child present, that difference is within the margin of error in 2021.
The median household income was significantly less for Black or African American compared to Hispanic/Latino residents and non-Hispanic, White residents. The median income for White and Hispanic/Latino residents in 2021 was $34,516 and $25,421 higher than Black residents, respectively.
All dollar amounts are expressed in 2021 dollars to control for inflation.
When determining median income by age and race/ethnicity, this indicator only considers the age and race/ethnicity of the householder, who is the individual who filled out the Census Bureau’s American Community Survey.
Due to pandemic disruptions, 2020 data is not comparable to previous years.
Data Sources
- U.S. Census Bureau (2022). Median Income in the Past 12 Months (In 2021 Inflation-Adjusted Dollars): Table S1903, 2010-2019 and 2021 American Community Survey 1-Year Estimates. Retrieved from data.census.gov.
- U.S. Census Bureau (2022). Median Household Income in the Past 12 Months (in 2021 Inflation-Adjusted Dollars): Table B19013, 2017-2021 American Community Survey 5-Year Estimates. Retrieved from data.census.gov.
Residents Experiencing Poverty
In practical terms, poverty indicates insufficient financial resources to pay for basic needs such as food, housing, and health care[1,2]. It is important to note that while poverty rates are widely used as a measure of financial hardship, there is some evidence that poverty rates rely on outdated assumptions, which can lead to underestimated family expenses and financial hardship[3]. For an alternative measure to poverty, see the income insufficiency measure above.
View poverty thresholds by family size from the US Census Bureau.
- Kushel, M., Gupta, R., Gee, L., & Haas, J. (2006). Housing instability and food security as barriers to health care among low-income Americans. Journal of General Internal Medicine, 21(1), 71-77. doi: 1111/j.1525-1497.2005.00278.x
- S. Census Bureau, Poverty thresholds by size of family and number of children. (2021). Retrieved from https://www.census.gov/data/tables/time-series/demo/income-poverty/historical-poverty-thresholds.html
- National Research Council (1995). Measuring poverty: A new approach. Washington, D.C.: National Academy Press. Retrieved from: https://www.nap.edu/read/4759
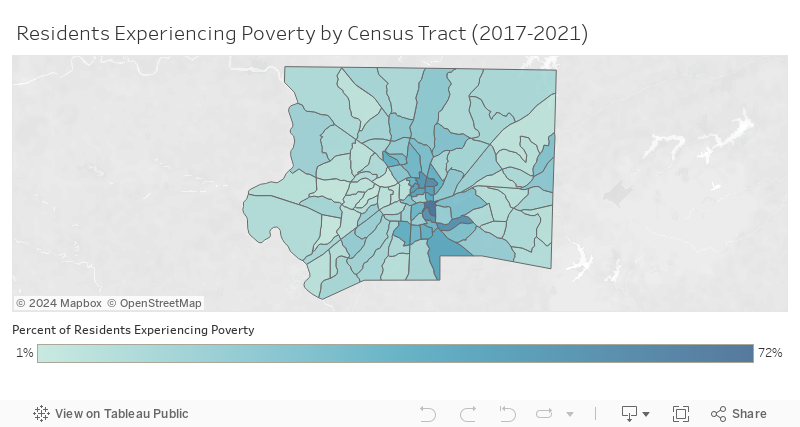
Forsyth County's poverty rate is decreasing. The poverty rate has decreased by 8 percentage points from 2012 to 2021.
Residents of Forsyth County experienced poverty at similar rates to other geographies. Forsyth County’s poverty rate was similar to that of Durham and Guilford counties and the rest of North Carolina and the United States.
Disparities were present in residents experiencing poverty by age. Residents in Forsyth County under the age of 18 were more likely to experience poverty compared to all age groups. In 2021, 20% of those under 18 experienced poverty compared to 13% of those 18 to 64 years old and 10% of those 65 and older.
Disparities were present in residents experiencing poverty by race/ethnicity. The poverty rates for Black or African American and Hispanic/Latino residents were higher than White, non-Hispanic residents.
Due to pandemic disruptions, 2020 data is not comparable to previous years. To learn more about these disruptions click here.
Hispanic/Latino estimates for the years 2007-2011, 2013-2014, 2016-2017, and 2021 are not as reliable due to the small sample size of the Hispanic/Latino population.
Data Sources
- U.S. Census Bureau (2022). Poverty Status in the Past 12 Months: Table S1701, 2006-2019 and 2021 American Community Survey 1-Year Estimates. Retrieved from data.census.gov.
- U.S. Census Bureau (2022). Poverty Status in the Past 12 Months: Table S1701, 2017-2021 American Community Survey 5-Year Estimates. Retrieved from data.census.gov.
If you are interested in using data from this report for rigorous purposes (such as program planning), please contact info@forsythfutures.org for a consultation on how best to proceed.
Key Measures
Demographic data includes information on Forsyth County’s population as well as sub-populations within the county based on factors such as geography, gender, age, and race/ethnicity.
Employment
About
Employment rates play a significant role in understanding our local economy. The employment rates presented here represent the percentage of the population that is at least 16 years old and employed for the total population and for all demographic breakdowns except sex. The employment rate by sex represents those that are between the ages of 20 to 64. Following a recession, the employment rate tends to not grow to any significant extent until the remainder of the economy has recovered, making it a lagging indicator [1].
- Pew Charitable Trust. (2013). Hard choices navigating the economic shock of unemployment. Retrieved from http://www.pewtrusts.org/~/media/legacy/uploadedfiles/pcs_assets/2013/empreportoverviewhardchoicesnavigatingtheeconomicshockofunemploymentpdf.pdf
Data
Map
Key Points
The employment rate remained relatively stable in Forsyth County from 2010-2021.
All comparison communities’ employment rate ranged from 57% to 62% in 2021. The employment rate in Forsyth County was 58% which was 4% lower than Durham County’s and 3% lower than Guilford County’s employment rate.
Disparities were present in employment rates for residents by age. In 2021, Forsyth County residents between the ages of 25 and 44 had an employment rate of 79% compared to 44% of 16 to 24 year olds and 70% of 45 to 64 year olds.
Disparities were present in employment rates for residents by sex for most years. The employment rate for male workers was consistently higher than the employment rate for female workers from 2010 to 2019. In 2021, the gap is smaller and within the margins of error, so analysts cannot be confident that the employment rates of males and females are different.
The employment rate in 2021 was similar for Black or African American and non-Hispanic White residents. Black or African American respondents’ lowest employment rate was at 49% in 2011 which increased to 57% in 2021 and is comparable to White residents’ employment rate of 56% in 2021.
Data Notes
Due to pandemic disruptions, 2020 data is not comparable to previous years. To learn more about these disruptions click here.
The Census suppressed several Hispanic/Latino estimates due to the small sample sizes in particular years.
Data Sources
- U.S. Census Bureau (2022). Employment Status: Table S2301, 2006-2019 and 2021 American Community Survey 1-Year Estimates. Retrieved from data.census.gov.
- U.S. Census Bureau (2022). Employment Status: Table S2301, 2017-2021 American Community Survey 5-Year Estimates. Retrieved from data.census.gov.
If you are interested in using data from this report for rigorous purposes (such as program planning), please contact info@forsythfutures.org for a consultation on how best to proceed.
Homeownership
About
The homeownership rate describes the percent of households who own their home. Owning a home, or other assets such as savings accounts, investments, and vehicles provides financial security that can protect households from unexpected expenses and decrease the likelihood of experiencing poverty[1]. While homeownership rates do not indicate overall wealth, or even the value of homes, they do indicate ownership of a valuable asset, which could provide financial security[1].
When determining homeownership rates by age and race/ethnicity, this indicator only considers the age and race/ethnicity of the householder, who is the individual who filled out the Census Bureau’s American Community Survey.
- Cramer, R. & Shanks, T. (2014). The assets perspective: The rise of asset building and its impact on social policy. New York, NY: Palgrave Macmillan.
Data
Map
Key Points
Homeownership rates in Forsyth County have ranged from 58% to 66% from 2006 to 2021. In 2021, the homeownership rate was 65% in the county.
Durham County had the lowest homeownership rate of all the comparison communities. In 2021, 55% of households in Durham County owned their own homes while 63% to 67% of households in the other comparison communities owned their own homes.
There are homeownership rate differences by age. Those under the age of 35 had the lowest homeownership rate among all age groups.
Racial and ethnic disparities in homeownership were large. White residents had consistently higher rates of homeownership compared to Black or African-American and Hispanic/Latino residents. In 2021, 74% of non-Hispanic White residents owned their homes compared to 48% of Black or African-American residents and 51% of Hispanic/Latino residents.
Data Notes
Due to pandemic disruptions, 2020 data is not comparable to previous years. To learn more about these disruptions click here.
Age Group: Due to the small sample size of 35 to 64 year olds and 65 years old and over in 2018,2019, and 2021 the estimates are not as reliable. Additionally, the estimate of those 65 years old and over in 2010 and those 15 to 34 years old in 2021 are not as reliable due to their small sample sizes and should be interpreted with caution.
Race/Ethnicity: With the exception of 2015, due to the small sample size of the Hispanic/Latino population, the homeownership rates for Hispanic/Latino residents are not as reliable.
Data Sources
- U.S. Census Bureau (2022). Tenure: Table B25003, 2006-2019 and 2021 American Community Survey 1-Year Estimates. Retrieved from data.census.gov.
- U.S. Census Bureau (2022). Tenure by Age of Householder: Table B25007, 2006-2019 and 2021 American Community Survey 1-Year Estimates. Retrieved from data.census.gov.
- U.S. Census Bureau (2022). Tenure (Black or African American Alone Householder): Table B25003B, 2006-2019 and 2021 American Community Survey 1-Year Estimates. Retrieved from data.census.gov.
- U.S. Census Bureau (2022). Tenure (Hispanic or Latino Householder): Table B25003I, 2006-2019 American and 2021 Community Survey 1-Year Estimates. Retrieved from data.census.gov.
- U.S. Census Bureau (2022). Tenure (White Alone, Not Hispanic or Latino Householder): Table B25003H, 2006-2019 and 2021 American Community Survey 1-Year Estimates. Retrieved from data.census.gov.
- U.S. Census Bureau (2022). Tenure: Table B25003, 2017-2021 American Community Survey 5-Year Estimates. Retrieved from data.census.gov.
If you are interested in using data from this report for rigorous purposes (such as program planning), please contact info@forsythfutures.org for a consultation on how best to proceed.
Housing Burden
About
When a significant portion of a household’s income is devoted to housing expenses, there is less money available to cover other basic needs such as food, health care, and transportation, a situation which may result in financial insecurity[1,2]. Housing cost burden measures housing expenses as a percentage of household income for homeowners and renters. The threshold for housing cost burden is when a household spends more than 30% of their income on housing expenses. Expenses include mortgage or rent payments, utilities, property taxes, insurance, and other fees.
- Cramer, R. & Shanks, T. (2014). The assets perspective: The rise of asset building and its impact on social policy. New York, NY: Palgrave Macmillan.
- Schwartz, M. & Wilson, E. (2007). Who can afford to live in a home?: A look at data from the 2006 American Community Survey. Retrieved from: https://www.census.gov/housing/census/publications/who-can-afford.pdf
Data
Key Points
Rates of housing burden rose significantly since 2007. Approximately, 40% of residents reported a housing cost burden in 2021 compared to 31% in 2007.
Forsyth County housing burden rates were higher than Durham County’s rates.
Disparities were present in housing burden rates by age group in Forsyth County. Approximately 31% of residents between the ages of 25 to 44 were cost burdened compared to 52% of those under the age 25, 41% of those between the ages of 45 and 64, and 47% of those 65 years and older.
Data Notes
Race/Ethnicity: All estimates for Hispanic/Latino residents are not as reliable as the other race/ethnicity groups due to the small sample size of the population.
Age Group: All estimates for those 24 years old and younger are not as reliable as the other age groups due to the small sample size of the population.
Due to pandemic disruptions, 2020 data is not comparable to previous years.
Data Sources
- U.S. Census Bureau (2021). American Community Survey (ACS), 1-Year Public Use Microdata Sample (PUMS), 2007-2019 and 2021. Retrieved from Public Use Microdata Sample (PUMS).
If you are interested in using data from this report for rigorous purposes (such as program planning), please contact info@forsythfutures.org for a consultation on how best to proceed.
Income by Quintile
About
Changes in household incomes do not always happen uniformly for high-and low-income earners. For example, incomes could rise for high-earning households and stay the same or drop for lower-earning households.
Income quintiles help illuminate how much incomes are changing for high- versus low-income households in our community. Income quintiles are defined in percentiles using upper-limit thresholds. For example, in 2021, the 20th percentile quintile for Forsyth County had an upper limit of $23,970, meaning that the income of twenty percent of the population was less than $23,970. Due to the general nature of quintiles, income thresholds change from year to year.
| Percentile | Meaning | 2021 Income Level |
|---|---|---|
| 20th | 20% of households have income at or below this level | $23,970 |
| 40th | 40% of households have income at or below this level | $46,026 |
| 60th | 60% of households have income at or below this level | $75,559 |
| 80th | 80% of households have income at or below this level | $120,918 |
| 95th | 95% of households have income at or below this level | $235,564 |
Trend
Comparison
Key Points
Household income across the three lowest incomes in Forsyth County decreased significantly from 2010 to 2021. Residents in the 20th, 40th, and 60th percentiles had a decrease in their household income by approximately $4,000 to $5,830 from 2010 to 2021. For example, controlling for inflation, the lowest or 20th percentile quintile had a household income of $27,972 in 2010 compared to $23,970 which is a decrease of over $4,000.
Disparities were present in income percentiles by race/ethnicity. At the lower end of the income distribution, Black or African Americans were overrepresented and White, non-Hispanics were underrepresented. Conversely, at the higher end of the income distribution White, non-Hispanics are overrepresented and Black or African Americans and Hispanic/Latino residents were underrepresented.
Data Notes
All dollar amounts are expressed in 2021 dollars to control for inflation.
Due to pandemic disruptions, 2020 data is not comparable to previous years.
Data Sources
- U.S. Census Bureau (2021). Household Income Quintile Upper Limits: Table B19080, 2006-2019 and 2021 American Community Survey 1-Year Estimates. Retrieved from data.census.gov.
- U.S. Census Bureau (2021). American Community Survey (ACS), 1-Year Public Use Microdata Sample (PUMS), 2021. Retrieved from Public Use Microdata Sample (PUMS).
If you are interested in using data from this report for rigorous purposes (such as program planning), please contact info@forsythfutures.org for a consultation on how best to proceed.
Median Income
About
Data
Map
Key Points
The median household income in Forsyth County was $59,879 in 2021. The median household income in 2021 was approximately $4,745 to $5,862 higher than the median household income in 2019 and 2018, respectively.
The median household income in Forsyth County was significantly lower than the national average from 2010 to 2021. The median national income was approximately $9,838 higher than Forsyth County’s median income in 2021. Also, in 2021 the median income was significantly higher in Durham County than in Forsyth County.
Householders between the ages of 25 to 44 and 45 to 64 had significantly higher median incomes than those under the age of 25 and those over the age of 65.
There were no significant differences between the median household income of residents with children present in the home than those without children present. While the estimate for households without a child present is slightly higher than households with a child present, that difference is within the margin of error in 2021.
The median household income was significantly less for Black or African American compared to Hispanic/Latino residents and non-Hispanic, White residents. The median income for White and Hispanic/Latino residents in 2021 was $34,516 and $25,421 higher than Black residents, respectively.
Data Notes
All dollar amounts are expressed in 2021 dollars to control for inflation.
When determining median income by age and race/ethnicity, this indicator only considers the age and race/ethnicity of the householder, who is the individual who filled out the Census Bureau’s American Community Survey.
Due to pandemic disruptions, 2020 data is not comparable to previous years.
Data Sources
- U.S. Census Bureau (2022). Median Income in the Past 12 Months (In 2021 Inflation-Adjusted Dollars): Table S1903, 2010-2019 and 2021 American Community Survey 1-Year Estimates. Retrieved from data.census.gov.
- U.S. Census Bureau (2022). Median Household Income in the Past 12 Months (in 2021 Inflation-Adjusted Dollars): Table B19013, 2017-2021 American Community Survey 5-Year Estimates. Retrieved from data.census.gov.
Residents Experiencing Poverty
About
In practical terms, poverty indicates insufficient financial resources to pay for basic needs such as food, housing, and health care[1,2]. It is important to note that while poverty rates are widely used as a measure of financial hardship, there is some evidence that poverty rates rely on outdated assumptions, which can lead to underestimated family expenses and financial hardship[3]. For an alternative measure to poverty, see the income insufficiency measure above.
View poverty thresholds by family size from the US Census Bureau.
- Kushel, M., Gupta, R., Gee, L., & Haas, J. (2006). Housing instability and food security as barriers to health care among low-income Americans. Journal of General Internal Medicine, 21(1), 71-77. doi: 1111/j.1525-1497.2005.00278.x
- S. Census Bureau, Poverty thresholds by size of family and number of children. (2021). Retrieved from https://www.census.gov/data/tables/time-series/demo/income-poverty/historical-poverty-thresholds.html
- National Research Council (1995). Measuring poverty: A new approach. Washington, D.C.: National Academy Press. Retrieved from: https://www.nap.edu/read/4759
Data
Map
Key Points
Forsyth County’s poverty rate is decreasing. The poverty rate has decreased by 8 percentage points from 2012 to 2021.
Residents of Forsyth County experienced poverty at similar rates to other geographies. Forsyth County’s poverty rate was similar to that of Durham and Guilford counties and the rest of North Carolina and the United States.
Disparities were present in residents experiencing poverty by age. Residents in Forsyth County under the age of 18 were more likely to experience poverty compared to all age groups. In 2021, 20% of those under 18 experienced poverty compared to 13% of those 18 to 64 years old and 10% of those 65 and older.
Disparities were present in residents experiencing poverty by race/ethnicity. The poverty rates for Black or African American and Hispanic/Latino residents were higher than White, non-Hispanic residents.
Data Notes
Due to pandemic disruptions, 2020 data is not comparable to previous years. To learn more about these disruptions click here.
Hispanic/Latino estimates for the years 2007-2011, 2013-2014, 2016-2017, and 2021 are not as reliable due to the small sample size of the Hispanic/Latino population.
Data Sources
-
- U.S. Census Bureau (2022). Poverty Status in the Past 12 Months: Table S1701, 2006-2019 and 2021 American Community Survey 1-Year Estimates. Retrieved from data.census.gov.
- U.S. Census Bureau (2022). Poverty Status in the Past 12 Months: Table S1701, 2017-2021 American Community Survey 5-Year Estimates. Retrieved from data.census.gov.
If you are interested in using data from this report for rigorous purposes (such as program planning), please contact info@forsythfutures.org for a consultation on how best to proceed.
Additional Measures
Additional Measures are less detailed than key measures and are intended to provide additional context for community uses such as grant writing and program planning.
If you have questions, please contact info@forsythfutures.org.
Food Insecurity
The Forsyth County food insecurity rate in 2020 was 13.6%.
Data Source
- Feeding America. (n.d.). Food Insecurity in Forsyth County. Retrieved November 21, 2022 from Feeding America.
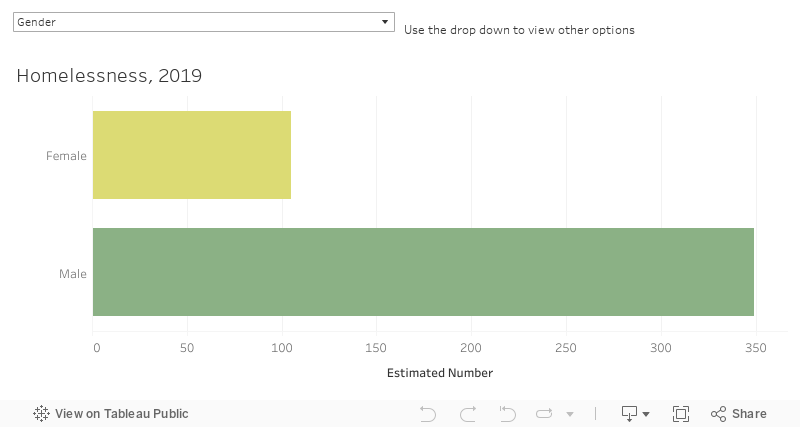
Homelessness
Data Source
- HUD Exchange, CoC Homeless Populations and Subpopulations Report. Data Year: 2018.
Home Values
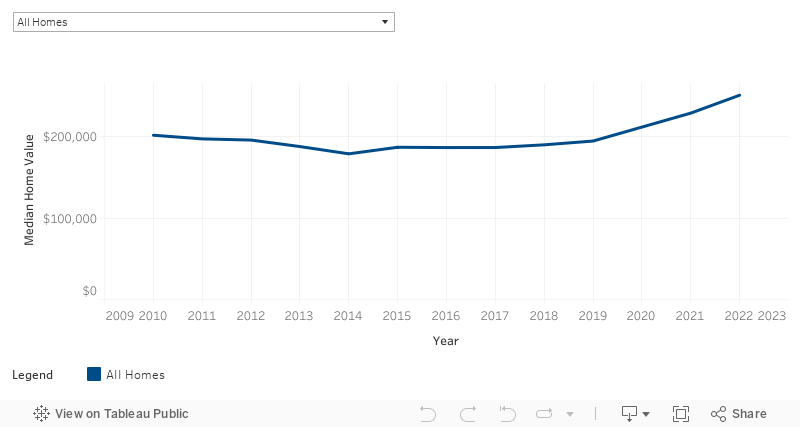
Estimates reflect the median home value in Forsyth County and comparison communities. All dollar amounts are expressed in 2022 dollars to control for inflation.
Due to pandemic disruptions, 2020 data is not comparable to previous years. To learn more about these disruptions click here.
Data Sources
U.S. Census Bureau (2023). Median Value (Dollars): Table B25077, 2010-2019 and 2021-2022 American Community Survey 1-Year Estimates. Retrieved from data.census.gov.
Largest Employers
| Rank | Company | Employees | Industry |
|---|---|---|---|
| 1 | Atrium Health Wake Forest Baptist | 18,570 | Health Care |
| 2 | Novant Health | 11,010 | Health Care |
| 3 | Winston-Salem/Forsyth County Schools | 5,500 | Public Education |
| 4 | BB&T/Truist | 4,000 | Financial Services |
| 5 | Wells Fargo | 3,500 | Financial Services |
| 6 | Reynolds American | 2,500 | Tobacco Manufacturing |
| 7 | Hanesbrands | 2,400 | Clothing |
| 8 | City of Winston-Salem | 2,287 | Government |
| 9 | Wake Forest University | 2,270 | Higher Education |
| 10 | Forsyth County | 2,127 | Government |
| 11 | AT&T | 2,000 | Communications |
| 12 (tied) | Lowes Food Stores | 1,500 | Grocery Chain |
| 12 (tied) | Collins Aerospace Interiors | 1,500 | Aerospace Interiors |
| 13 (tied) | National General Insurance | 1,200 | Insurance |
| 13 (tied) | Forsyth Technical College | 1,200 | Education |
| 14 | Herbalife | 1,100 | Healthcare Supplements |
| 15 (tied) | YMCA of NWNC | 1,000 | Non-Profit |
| 15 (tied) | Winston-Salem State University | 1,000 | Higher Education |
| 16 | Inmar Inc. | 950 | Logistics & Data Analytics |
| 17 | Hayward Industries | 940 | Pumps & Pool Equipment |
| 18 | Flow Automotive Companies | 875 | Automotive Sales & Service |
| 19 | Deere-Hitachi | 850 | Excavators |
| 20 | The Budd Group | 750 | Landscaping |
| 21 (tied) | PepsiCo | 700 | Beverage Distribution |
| 21 (tied) | WestRock | 700 | Packaging |
| 22 | Cook Medical | 640 | Medical Device Manufacturing |
| 23 | Truiliant Federal Credit Union | 620 | Financial Services |
| 24 | Womble Bond Dickenson | 530 | Legal Services |
| 25 | Best Logistics Group | 505 | Logistics & Freight |
| 26 (tied) | IFB Solutions (Industries for the Blind) | 500 | Blind Services & Manufacturing |
| 26 (tied) | Johnson Controls Inc. | 500 | Controls Systems & Regulators |
Data Source
- Greater Winston-Salem, Inc. (2021, May). Major Employers. Retrieved November 2, 2021 from https://www.winstonsalem.com/economic-development/local-data/major-employers/.
Largest Industries
Industry Employees
Health care and social assistance 24,229
Manufacturing 20,151
Educational services 10,761
Finance and insurance 9,638
Construction 9,572
Retail trade 9,477
Professional, scientific, and technical services 8,415
Other services (except public administration) 5,841
Transportation and warehousing 5,739
Administrative and support and waste management services 5,634
Accommodation and food services 4,243
Public administration 4,083
Wholesale trade 3,590
Information 1,548
Real estate rental and leasing 925
Arts, entertainment, and recreation 883
Agriculture, forestry, fishing and hunting 679
Utilities 578
Management of companies and enterprises 170
Mining 72
Data Source
- U.S. Census Bureau (2022). Industry By Sex for the Full-Time, Year-Round Civilian Employed Population 16 Years And Over: Table S2404, 2021: American Community Survey 1-year estimate. Retrieved from data.census.gov.
Reports and Briefings
This section contains various reports that are relevant to economy and financial stability in our community. Listed reports may have been produced by Forsyth Futures or others in the community.
If you have questions, please contact info@forsythfutures.org.
Through a Gender Lens: The Economic Security of Women and Girls in Forsyth County in 2020

Produced by The Women’s Fund of the Winston-Salem Foundation in partnership with Forsyth Futures.
After seeing the importance of highlighting data that focused on the economic security of women and girls in Forsyth County, The Women’s Fund committed to producing a report of its nature every five years. While we chose a print format for our two previous reports, we decided to take a different approach with our third Through a Gender Lens report by presenting it as an interactive microsite with the goal to make the information more accessible and engaging.
Community Briefing: The Local Impact of COVID-19, 2020

Produced by Forsyth Futures; 2020
As we navigate the COVID-19 pandemic, local economic conditions are evolving faster than Forsyth Futures can measure using the data sources we typically rely on to inform community decision making. The purpose of this Briefing is to provide the most useful information possible about our rapidly-changing local economic conditions to community leaders and stakeholders. The report includes a dashboard, a literature review featuring interviews with local experts, and analyses of an expanded range of community measures. Our goal in producing this report is to encourage and support data-informed planning and decision making locally.
Key Measures Report, 2020
Produced by Forsyth Futures.
Forsyth Futures’ Key Measures Report serves as a compilation of recent, commonly-requested, community-specific, reference information to aid informed public consideration and grant-writing activities in Forsyth County. The contents of this report address demographics and various topics related to the economy, health and wellness, education, and safety in Forsyth County.
The Benefits Cliff in Forsyth County, 2019

Produced by Forsyth Futures
The benefits cliff, or cliff effect, occurs when a small pay increase disqualifies a worker from public benefit programs and abruptly reduces his or her household resources, causing unexpected financial crisis. Forsyth County ranks among the worst counties in the nation for economic mobility. For a working family striving to advance economically, the sudden loss of public benefits is devastating.
The Legacy 2030 Update: The Comprehensive Plan for Winston-Salem, Forsyth County, and its Towns; 2018
Prepared for the Citizens of Forsyth County by the City-County Planning Board. Published in 2018.
The Planning Board appointed the 21-member Legacy Steering Committee with representatives from across Forsyth County to guide the visioning process. Over 100 citizens were enlisted by the steering committee and organized into eight focus groups. “Forsyth County Tomorrow” (to be referred to herein as Our Vision), was the first result of their efforts. Our Vision calls for growing smarter and better by managing future development. In fact, the title of the plan document, Legacy, identifies the overarching theme – we are stewards of the community and we have an obligation to protect and enhance it as our legacy to future generations.
Forsyth County Poverty Study, 2017

Produced by Forsyth Futures
The Forsyth County Poverty Study was carried out between 2015 and 2017 to inform efforts to improve the conditions of poverty in Forsyth County. A primary goal of the study was to identify which risk factors could contribute to poverty and disparities in poverty in Forsyth County. Forsyth Futures’ role in authoring the study was to provide a source of unbiased analyses to serve as a community resource; it was not Forsyth Futures’ role to identify or advocate for specific actions or policies.
A Second Look Through a Gender Lens: The Economic Security of Women and Girls in Forsyth County in 2015
Produced by The Women’s Fund of the Winston-Salem Foundation.
In 2010, The Women’s Fund published a report on women and girls in our community — the first time that data on the lives of more than half of our population had ever been assembled. That report, Through a Gender Lens: The Economic Security of Women and Girls in Forsyth County, told us a great deal about work, wages, poverty, education, and healthcare at the time, and women’s strengths overall and challenges they face. Women in our community were resilient, but too many were living without the financial resources they needed for a safe and secure life for themselves and for their children. We resolved to do better.
Emergency Food Assistance Efforts in Forsyth County, 2014
Produced by Forsyth Futures, 2014
An Initiascape provides a map of the landscape of our community’s efforts about a particular initiative. It also serves as a resource directory of those programs that are connected through a common initiative. Initiascapes are designed to increase opportunities for collaboration and cooperation in order to more efficiently use our community’s resources. This Initiascape study about Emergency Food Assistance is designed to help connect the community “dots” of those who provide emergency food assistance in Forsyth County.
Forsyth County Community Food System, 2013
Produced by Forsyth Futures, 2013
In 2010, The Women’s Fund published a report on women and girls in our community — the first time that data on the lives of more than half of our population had ever been assembled. That report, Through a Gender Lens: The Economic Security of Women and Girls in Forsyth County, told us a great deal about work, wages, poverty, education, and healthcare at the time, and women’s strengths overall and challenges they face. Women in our community were resilient, but too many were living without the financial resources they needed for a safe and secure life for themselves and for their children. We resolved to do better.
Homelessness Making Progress Report, 2013
Produced by Forsyth Futures, 2013
The Making Progress Report: Homelessness is part of the Economic Self-Sufficiency series. Residents who are economically self-sufficient have the ability to care for themselves and their families without relying on assistance for basic needs. Other indicators within the series include: Income, Housing, Food Assistance, Employment, Employers Data and analysis of other indicators in the series are located on the Forsyth Futures’ website (www.forsythfutures.org). The following report provides a description of the homelessness indicator, identifies measures of homelessness and key findings, and examines what is needed Forsyth County to continue to Make Progress.
Table 1: List of Expenses Used to Calculate Income Insufficiency
| Expense Category | Source Name | Source Institution | Geographic Level of Data | Circumstances Accounted for |
|---|---|---|---|---|
| Childcare | Personal Correspondence | North Carolina State University | State | Age, presence of nonworking adults who could provide free childcare |
| Food | Low Cost Food Plan | US Department of Agriculture | Region | Age, sex |
| Housing | Fair Market Rents | US Department of Housing and Urban Development | County | Family and household size/comparison |
| Transportation | Consumer Expenditure Survey | Bureau of Labor Statistics | Region | Family size |
| Healthcare | Medical Expenditure Panel Survey | US Department of Health and Human Services | Region | Family size |
| Health Insurance | Consumer Expenditure Survey | Bureau of Labor Statistics | Region | Family size, age |
| Other Expenses | Consumer Expenditure Survey | Bureau of Labor Statistics | Region | Family size |
| Taxes | Federal and State Tax Codes//Taxsim | US Congress | National and State | Income, wages, standard deduction, exemptions, some credits |
Table 2: Itemized List of Expenses by Example Household Composition
| One Adult | Two Working Adults | Two Parents, One Working, with a 2 and 4 year old | Two Working Adults with a 2 and 4 year old | One Adult with a 2 and 4 year old | |
|---|---|---|---|---|---|
| Childcare | $0 | $0 | $0 | $16,962 | $16,962 |
| Food | $2,867 | $5,369 | $8,601 | $8,601 | $5,734 |
| Housing | $6,996 | $6,996 | $8,748 | $8,748 | $8,748 |
| Transportation | $4,620 | $8,457 | $12,638 | $12,638 | $10,571 |
| Healthcare | $430 | $860 | $1,030 | $1,030 | $600 |
| Health Insurance | $2,116 | $4,232 | $4,111 | $4,111 | $3,818 |
| Other Expenses | $2,562 | $4,265 | $5,615 | $5,615 | $4,621 |
| Taxes | $3,537 | $4,483 | -$5,076 | $6,221 | $7,078 |
| Total Estimated Expenses | $23,128 | $34,662 | $35,667 | $63,926 | $58,132 |
Table 3: Total Expenses Compared with Federal Poverty Threshold by Example Household Composition.
| One Adult | Two Working Adults | Two Aduts, One Working, with a 2 and 4 year old | Two Working Adults with a 2 and 4 year old | One Adult with a 2 and 4 year old | |
|---|---|---|---|---|---|
| Total Estimated Expenses | $23,128 | $34,662 | $35,667 | $63,926 | $58,132 |
| Poverty Threshold | $13,300 | $17,196 | $25,926 | $25,926 | $20,598 |
Community Research Framework
Individual Forsyth Futures reports are generally written to provide focused information on specific issues to inform community action. While these topics are generally measured in separate reports for clarity, it is important to acknowledge that all of the local issues we study are interconnected. For example, food insecurity is generally measured separately from reading proficiency scores, but in reality being a part of a family experiencing food insecurity can have a significant impact on children’s ability to learn and be successful in school.
Two Complementary Frameworks
To guide our reporting as we navigate this complexity, Forsyth Futures uses two frameworks which consider interconnected topical dimensions and dimensions of context and scale, respectively. Taken together, these two frameworks provide an opportunity for community stakeholders to consider how issues that appear separate in their reporting may be interconnected.

Interconnected Topical Dimensions
This framework model shows that despite how topics are separated to make information easier to access and communicate, many of the sectors that we study are interconnected, like a student’s economic stability and their ability to be successful in school.
Built and Physical Environment
Economy and Financial Stability
Education
Health and Wellness
Safety
Social and Civic Environment

Dimensions of Context and Scale
This framework model is based on a commonly-used social determinants of health model called the Social-Ecological model. This model illustrates how individuals and families are impacted by the broader contexts in which they exist. For example, an individual child’s test score measures their reading proficiency at the individual level, but it is important to acknowledge the impact that a child’s family, neighborhood, and school have on the child’s success.