
Community Data
Built and Physical Environment
Reliable local data encourages and supports data-informed decision making by community stakeholders at all levels. This information is designed to simplify the process of using data to inform the work that moves our community forward — program planning and evaluation, funding and resource allocation, grant writing, and more. If you have questions, please contact info@forsythfutures.org.
Key Measures
Key Measures help us better understand how our community is changing over time.
If you have questions, please contact info@forsythfutures.org.
Air Quality
The Air Quality Index (AQI) is a measurement used to communicate the level of air pollution to the public and what associated health risks may be a concern. With increasing levels of pollution, the index number will increase. These numbers are determined by calculating the average of readings over a period of time. For Forsyth County, the air quality is calculated hourly at multiple monitoring stations. Each pollutant is measured and considered in the final index.
The AQI is calculated using standards set by the Clean Air Act (CAA). The standards relating to the CCA are focused on five common pollutants: particulate matter (PM), ozone (O3), sulfur dioxide (SO2), nitrogen dioxide (NO2), and carbon monoxide (CO). The EPA has established national air quality standards for each of these pollutants to protect public health[1].
Air Quality Index Levels
| Level | Index Range | Explanation |
|---|---|---|
| Good | 0 - 50 | Air pollution poses little or no risk. |
| Moderate | 51 - 100 | For some pollutants there may be a moderate health concern for a very small number of people. |
| Unhealthy for Sensitive Groups | 101 - 150 | The general public is not likely to be affected at this AQI range, but people with lung disease, older adults, and children are at a greater risk from exposure to ozone and from the presence of particles in the air. |
| Unhealthy | 151 - 200 | Everyone may begin to experience some adverse health effects, and members of the sensitive groups may experience more serious effects. |
| Very Unhealthy | 201 - 300 | This triggers a health alert signifying that everyone may experience more serious health effects. Everyone should avoid prolonged or heavy exertion. |
The chart describes the AQI levels and associated index range. If an area reports an AQI of 25, then that day falls within the ‘Good’ range. However, if they report an AQI of 115, this falls within the orange category: ‘Unhealthy for Sensitive Groups' and so forth. Each level has suggested level of outdoor activity for certain groups of people.
- The Clean Air Act, Amendments of 1990, 42 U.S.C. §7401et seq, (1990)
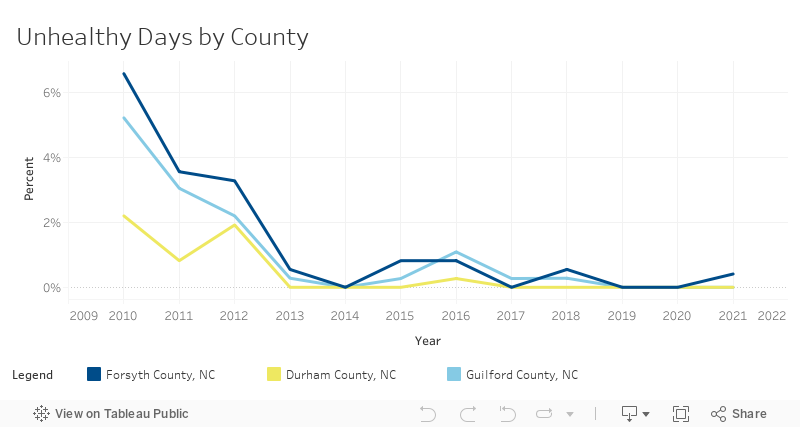
There was only one day (<.05%) with an AQI considered unhealthy, or more than 100, in 2021 in Forsyth County. AQI values below 100 are generally thought of as satisfactory; it corresponds to the national air quality standard that the EPA has set to protect public health. When AQI values are above this threshold, the air quality is considered unhealthy.
Unhealthy Days represents a combination of Unhealthy Days and Unhealthy Days for Sensitive Groups, and the percentage is based on the number of days the Air Quality Index (AQI) was collected for each county which is not always equal to days in a calendar year. For example, in 2021 the AQI for all three counties was collected for 243 days.
Data Sources
- U.S. EPA (2021). Annual Summary Data from AQI by County. Retrieved from https://aqs.epa.gov on December 21, 2021.
If you are interested in using data from this report for rigorous purposes (such as program planning), please contact info@forsythfutures.org for a consultation on how best to proceed.
Key Measures
Demographic data includes information on Forsyth County’s population as well as sub-populations within the county based on factors such as geography, gender, age, and race/ethnicity.
Air Quality
About
The Air Quality Index (AQI) is a measurement used to communicate the level of air pollution to the public and what associated health risks may be a concern. With increasing levels of pollution, the index number will increase. These numbers are determined by calculating the average of readings over a period of time. For Forsyth County, the air quality is calculated hourly at multiple monitoring stations. Each pollutant is measured and considered in the final index.
The AQI is calculated using standards set by the Clean Air Act (CAA). The standards relating to the CCA are focused on five common pollutants: particulate matter (PM), ozone (O3), sulfur dioxide (SO2), nitrogen dioxide (NO2), and carbon monoxide (CO). The EPA has established national air quality standards for each of these pollutants to protect public health.
Air Quality Index Levels
| Level | Index Range | Explanation |
|---|---|---|
| Good | 0 - 50 | Air pollution poses little or no risk. |
| Moderate | 51 - 100 | For some pollutants there may be a moderate health concern for a very small number of people. |
| Unhealthy for Sensitive Groups | 101 - 150 | The general public is not likely to be affected at this AQI range, but people with lung disease, older adults, and children are at a greater risk from exposure to ozone and from the presence of particles in the air. |
| Unhealthy | 151 - 200 | Everyone may begin to experience some adverse health effects, and members of the sensitive groups may experience more serious effects. |
| Very Unhealthy | 201 - 300 | This triggers a health alert signifying that everyone may experience more serious health effects. Everyone should avoid prolonged or heavy exertion. |
The chart describes the AQI levels and associated index range. If an area reports an AQI of 25, then that day falls within the ‘Good’ range. However, if they report an AQI of 115, this falls within the orange category: ‘Unhealthy for Sensitive Groups’ and so forth. Each level has suggested level of outdoor activity for certain groups of people.
- WAITING ON TEAM RESOLUTION TO CITATION FORMAT
Data
Key Points
There was only one day (<.05%) with an AQI considered unhealthy, or more than 100, in 2021 in Forsyth County. AQI values below 100 are generally thought of as satisfactory; it corresponds to the national air quality standard that the EPA has set to protect public health. When AQI values are above this threshold, the air quality is considered unhealthy.
Data Notes
Unhealthy Days represents a combination of Unhealthy Days and Unhealthy Days for Sensitive Groups, and the percentage is based on the number of days the Air Quality Index (AQI) was collected for each county which is not always equal to days in a calendar year. For example, in 2021 the AQI for all three counties was collected for 243 days.
Data Sources
- U.S. EPA (2021). Annual Summary Data from AQI by County. Retrieved from https://aqs.epa.gov on December 21, 2021.
If you are interested in using data from this report for rigorous purposes (such as program planning), please contact info@forsythfutures.org for a consultation on how best to proceed.
Reports and Briefings
This section contains various reports that are relevant to community demographics. Listed reports may have been produced by Forsyth Futures or others in the community.
If you have questions, please contact info@forsythfutures.org.
Forsyth County Community Food System
Produced by Forsyth Futures, 2013
In 2010, The Women’s Fund published a report on women and girls in our community — the first time that data on the lives of more than half of our population had ever been assembled. That report, Through a Gender Lens: The Economic Security of Women and Girls in Forsyth County, told us a great deal about work, wages, poverty, education, and healthcare at the time, and women’s strengths overall and challenges they face. Women in our community were resilient, but too many were living without the financial resources they needed for a safe and secure life for themselves and for their children. We resolved to do better.
Community Research Framework
Individual Forsyth Futures reports are generally written to provide focused information on specific issues to inform community action. While these topics are generally measured in separate reports for clarity, it is important to acknowledge that all of the local issues we study are interconnected. For example, food insecurity is generally measured separately from reading proficiency scores, but in reality being a part of a family experiencing food insecurity can have a significant impact on children’s ability to learn and be successful in school.
Two Complementary Frameworks
To guide our reporting as we navigate this complexity, Forsyth Futures uses two frameworks which consider interconnected topical dimensions and dimensions of context and scale, respectively. Taken together, these two frameworks provide an opportunity for community stakeholders to consider how issues that appear separate in their reporting may be interconnected.

Interconnected Topical Dimensions
This framework model shows that despite how topics are separated to make information easier to access and communicate, many of the sectors that we study are interconnected, like a student’s economic stability and their ability to be successful in school.
Built and Physical Environment
Economy and Financial Stability
Education
Health and Wellness
Safety
Social and Civic Environment

Dimensions of Context and Scale
This framework model is based on a commonly-used social determinants of health model called the Social-Ecological model. This model illustrates how individuals and families are impacted by the broader contexts in which they exist. For example, an individual child’s test score measures their reading proficiency at the individual level, but it is important to acknowledge the impact that a child’s family, neighborhood, and school have on the child’s success.